

Question: Using the scenarios in case Exhibit 9, what role does leverage play in affecting the return on equity (ROE) for CPK? What about the cost
Using the scenarios in case Exhibit 9, what role does leverage play in affecting the return on equity (ROE) for CPK? What about the cost of capital? In assessing the effect of leverage on the cost of capital, you may assume that a firms CAPM beta can be modeled in the following manner: L= U[1 + (1 T)D/E], where U is the firms beta without leverage, T is the corporate income tax rate, D is the market value of debt, and E is the market value of equity.
![modeled in the following manner: L= U[1 + (1 T)D/E], where U](https://dsd5zvtm8ll6.cloudfront.net/si.experts.images/questions/2024/09/66f7ec23c1a07_87566f7ec233fc8f.jpg)
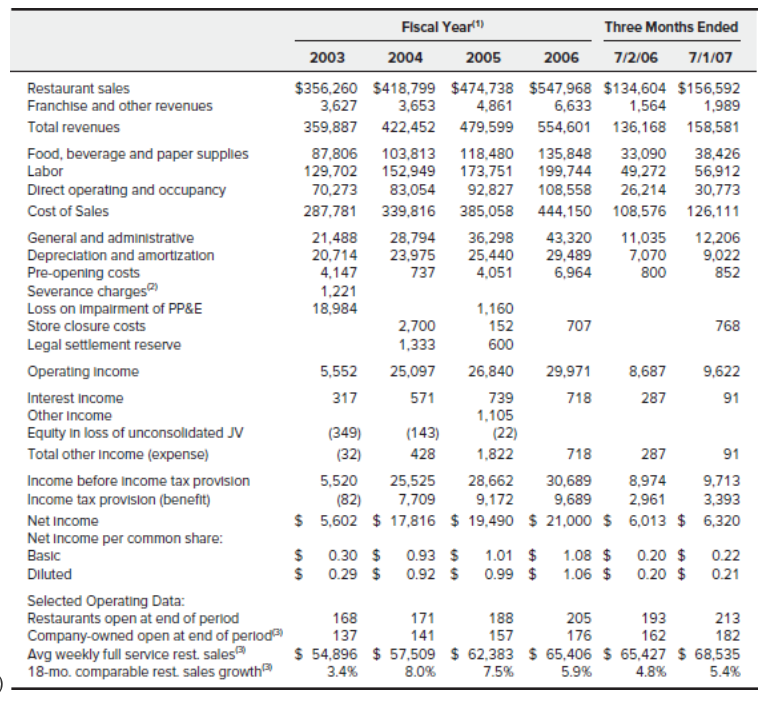
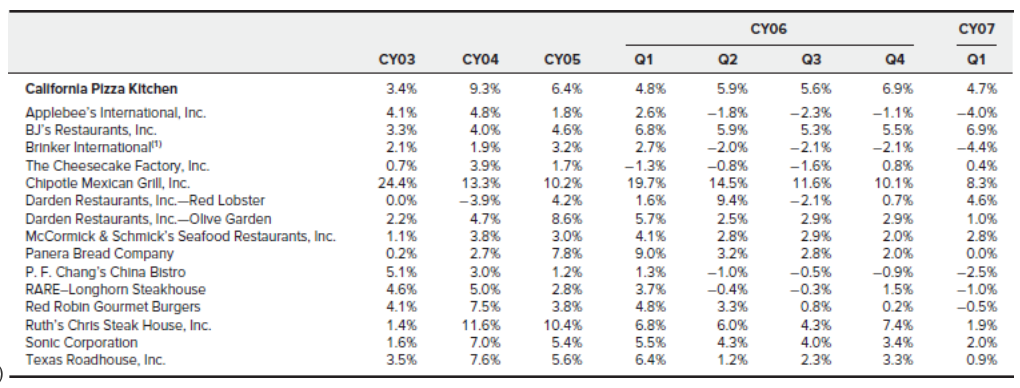
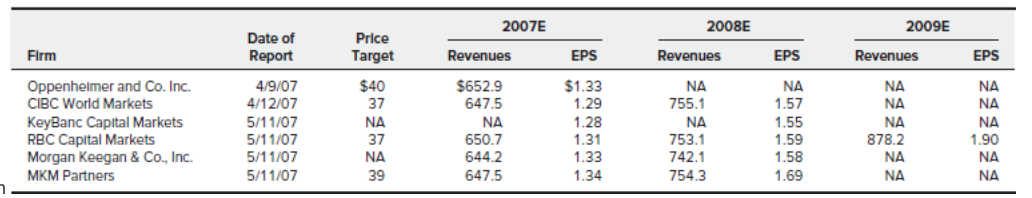
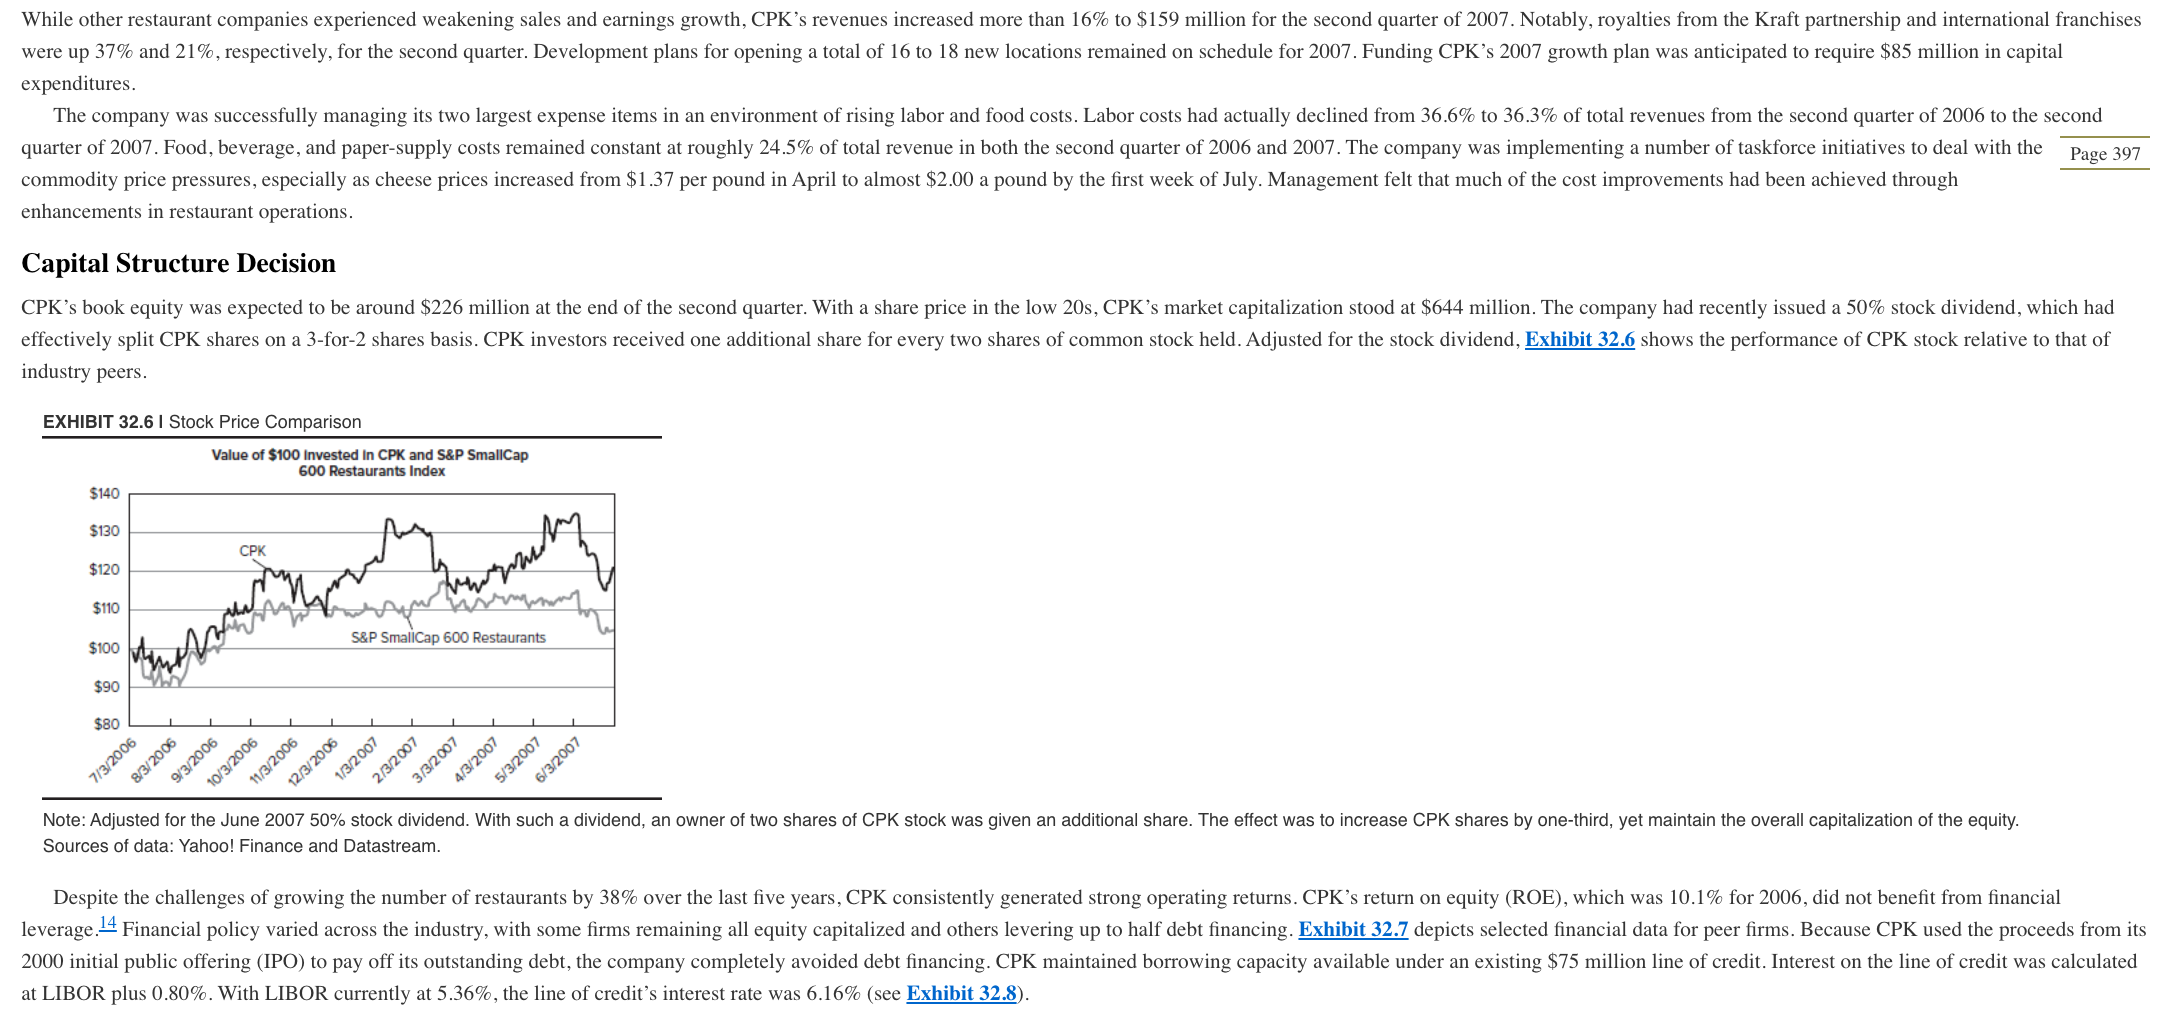
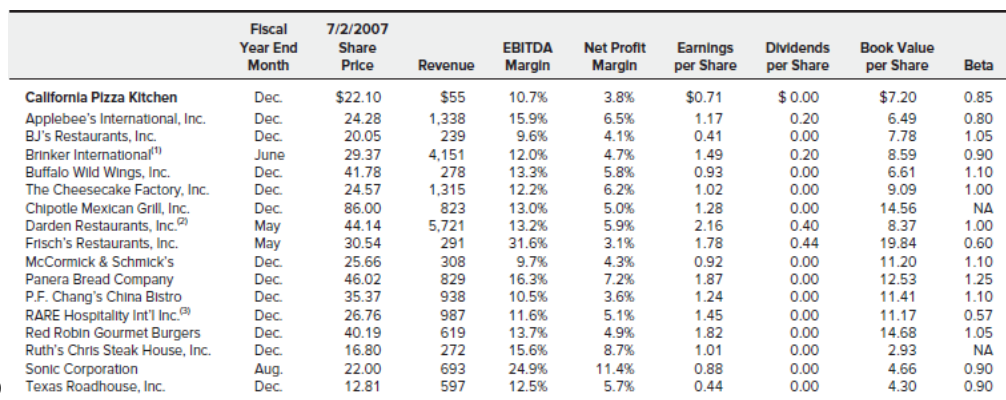
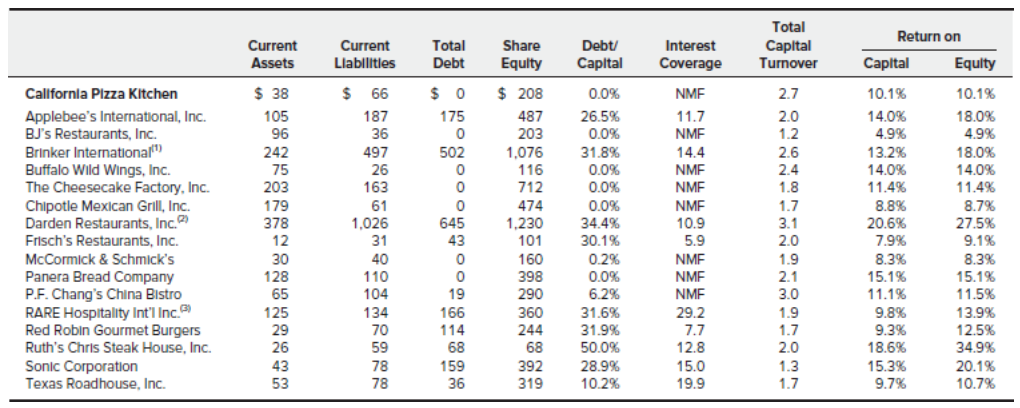
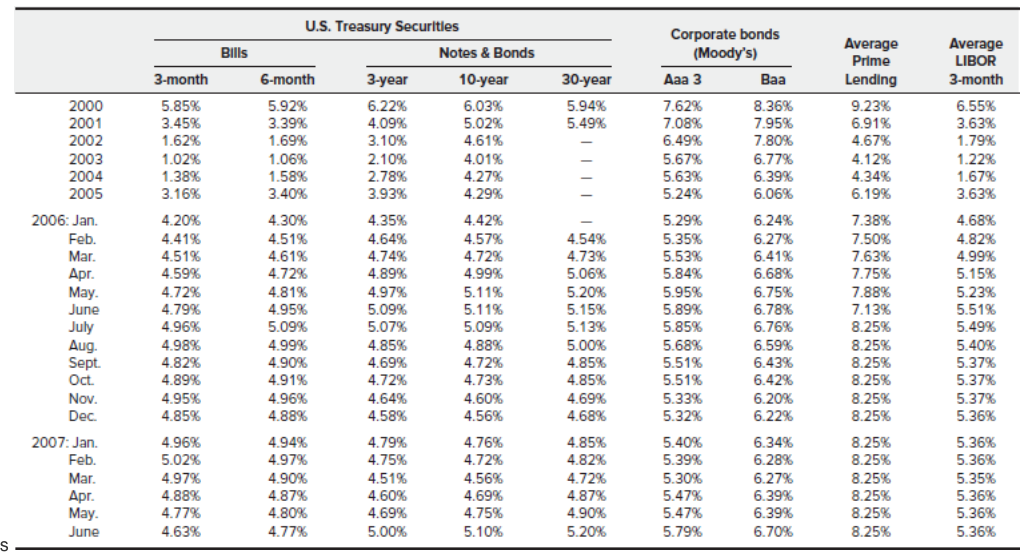
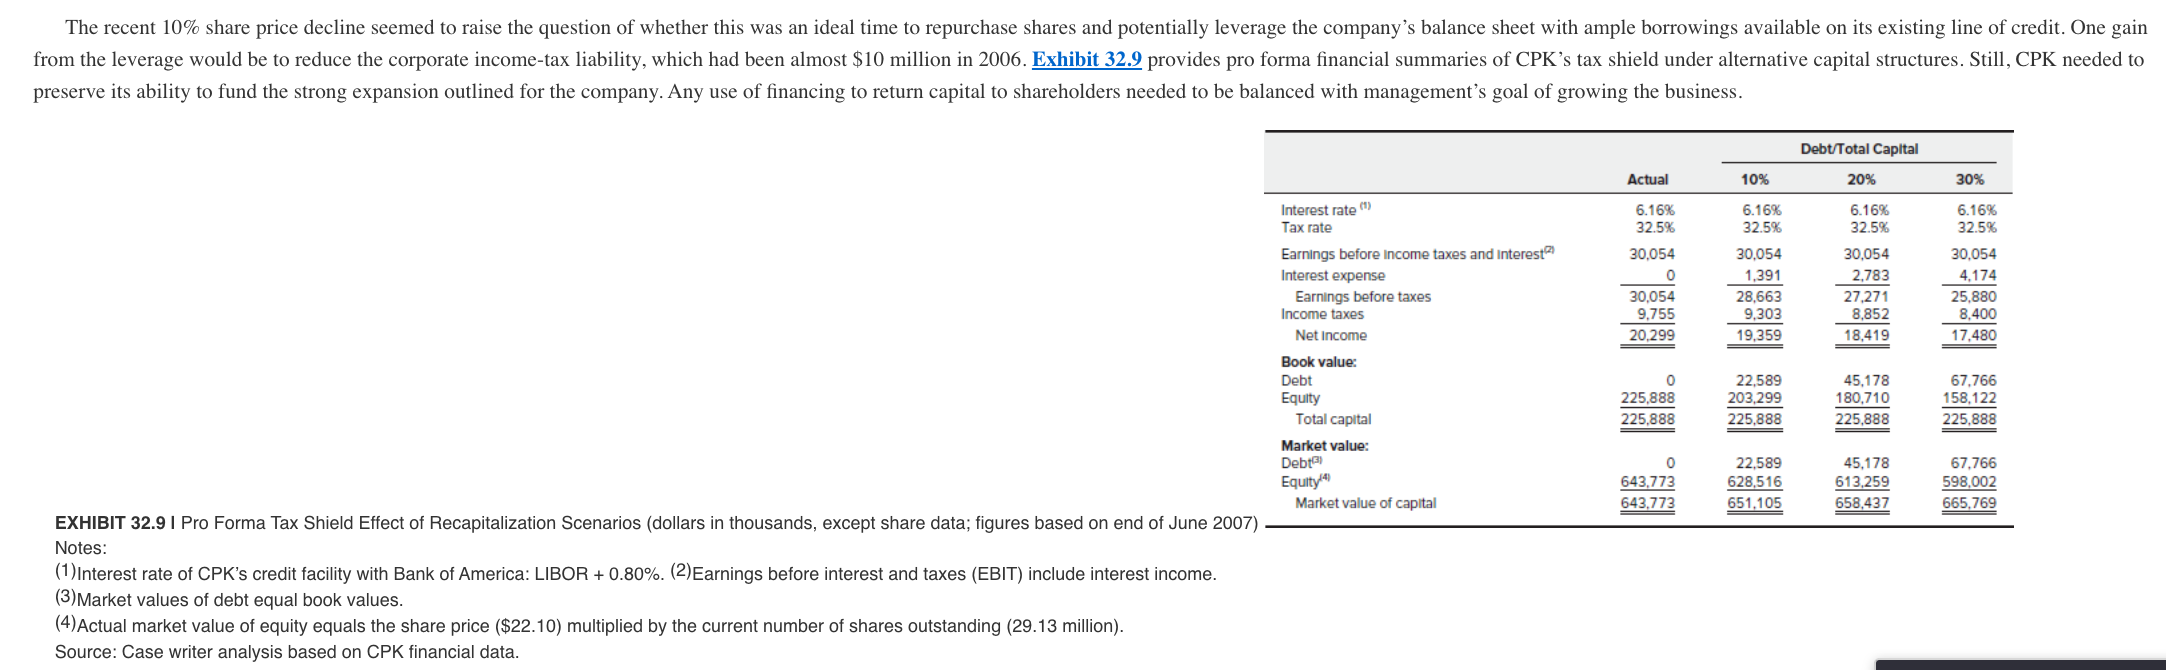
CASE 32 California Pizza Kitchen Everyone knows that 95% of restaurants fail in the first two years, and a lot of people think it's "location, location, location." It could be, but my experience is you have to have the financial staying power. You could have the greatest idea, but many restaurants do not start out making money-they build over time. So it's really about having the capital and the staying power. - Rick Rosenfield, Co-CEO, California Pizza Kitchen In early July 2007, the financial team at California Pizza Kitchen (CPK), led by Chief Financial Officer Susan Collyns, was compiling the preliminary results for the second quarter of 2007. Despite industry challenges of rising commodity, labor, and energy costs, CPK was about to announce near-record quarterly profits of over $6 million. CPK's profit expansion was explained by strong revenue growth with comparable restaurant sales up over 5%. The announced numbers were fully in line with the company's forecasted guidance to investors. The company's results were particularly impressive when contrasted with many other casual dining firms, which had experienced sharp declines in customer traffic. Despite the strong performance, industry difficulties were such that CPK's share price had declined 10% during the month of June to a current value of $22.10. Given the price drop, the management team had discussed repurchasing company shares. With little money in excess cash, however, a large share repurchase program would require debt financing. Since going public in 2000, CPK's management had avoided putting any debt on the balance sheet. Financial policy was conservative to preserve what co-CEO Rick Rosenfeld referred to as staying power. The view was that a strong balance sheet would maintain the borrowing ability needed to support CPK's expected growth trajectory. Yet with interest rates on the rise from historical lows, Collyns was aware of the benefits of moderately levering up CPK's equity. California Pizza Kitchen Inspired by the gourmet pizza offerings at Wolfgang Puck's celebrity-filled restaurant, Spago, and eager to flee their careers as white-collar criminal defense attorneys, Larry Flax and Rick Rosenfield created the first California Pizza Kitchen in 1985 in Beverly Hills, California. Known for its hearth-baked barbecue-chicken pizza, the designer pizza at off-the-rack prices concept flourished. Expansion across the state, country, and globe followed in the subsequent two decades. At the end of the second quarter of 2007, the company had 213 locations in 28 states and 6 foreign countries. While still very California-centric (approximately 41% of the U.S. stores were in California), the casual dining model had done well throughout all U.S. regions with its family-friendly surroundings, excellent ingredients, and inventive offerings. California Pizza Kitchen derived its revenues from three sources: sales at company-owned restaurants, royalties from franchised restaurants, and royalties from a partnership with Kraft Foods to sell CPK-branded frozen pizzas in grocery stores. While the company had expanded beyond its original concept with two other restaurant brands, its main focus remained on operating company-owned full-service CPK restaurants, of which there were 170 units. Analysts conservatively estimated the potential for full-service company-owned CPK units at 500. Both the investment community and management were less certain about the potential for the company's chief attempt at brand extension, its ASAP restaurant concept. In 1996, the company first developed the ASAP concept in a franchise agreement with HMSHost. The franchised ASAPs were located in airports and featured a limited selection of pizzas and grab-n-go salads and sandwiches. While not a huge revenue source, management was pleased with the success of the airport ASAP locations, which currently numbered 16. In early 2007, HMS Host and CPK agreed to extend their partnership through 2012. But the sentiment was more mixed regarding its company-owned ASAP locations. First opened in 2000 to capitalize on the growth of fast casual dining, the company-owned ASAP units offered CPK's most-popular pizzas, salads, soups, and sandwiches with in-restaurant seating. Sales and operations at the company-owned ASAP units never met management's expectations. Even after retooling the concept and restaurant prototype in 2003, management decided to halt indefinitely all ASAP development in 2007 and planned to record roughly $770,000 in expenses in the second quarter to terminate the planned opening of one ASAP location. Although they had doubts associated with the company-owned ASAP restaurant chain, the company and investment community were upbeat about CPK's success and prospects with franchising full-service restaurants internationally. At the beginning of July 2007, the company had 15 franchised international locations, with more openings planned for the second half of 2007. Management sought out knowledgeable franchise partners who would protect the company's brand and were capable of growing the number of international units. Franchising agreements typically gave CPK an initial payment of $50,000 to $65,000 for each location opened and then an estimated 5% of gross sales. With locations already in China (including Hong Kong), Indonesia, Japan, Malaysia, the Philippines, and Singapore, the company planned to expand its global reach to Mexico and South Korea in the second half of 2007. Management saw its Kraft partnership as another initiative in its pursuit of building a global brand. In 1997, the company entered into a licensing agreement with Kraft Foods to distribute CPK-branded frozen pizzas. Although Page 393 representing less than 1% of current revenues, the Kraft royalties had a 95% pretax margin, one equity analyst estimated. In addition to the high-margin impact on the company's bottom line, management also highlighted the marketing requirement in its Kraft partnership. Kraft was obligated to spend 5% of gross sales on marketing the CPK frozen pizza brand, more than the company often spent on its own marketing. Management believed its success in growing both domestically and internationally, and through ventures like the Kraft partnership, was due in large part to its "dedication to guest satisfaction and menu innovation and sustainable culture of two co-founders still heading the menu-development team. Exhibit 32.1 contains a selection of CPK menu offerings. Its menu items offer customers distinctive, compelling flavors to commonly recognized foods, A Morgan Keegan analyst wrote. While the company had a narrower, more-focused menu than some of its peers, the chain prided itself on creating craved items, such as Singapore Shrimp Rolls, that distinguished its menu and could not be found at its casual dining peers. This strategy was successful, and internal research indicated a specific menu craving that could not be satisfied elsewhere prompted many patron visits. To maintain the menu's originality, management reviewed detailed sales reports twice a year and replaced slow-selling offerings with new items. Some of the company's most recent menu additions in 2007 had been developed and tested at the company's newest restaurant concept, the LA Food Show. Created by Flax and Rosenfield in 2003, the LA Food Show offered a more upscale experience and expansive menu than CPK. CPK increased its minority interest to full ownership of the LA Food Show in 2005 and planned to open a second location in early 2008. Appetizers Avocado Club Egg Rolls: A fusion of East and West with fresh avocado, chicken, tomato, Monterey Jack cheese, and applewood smoked bacon, wrapped in a crispy wonton roll. Served with ranchito sauce and herb ranch dressing. Singapore Shrimp Rolls: Shrimp, baby broccoli, soy-glazed shiitake mushrooms, romaine, carrots, noodles, bean sprouts, green onion, and cilantro wrapped in rice paper. Served chilled with a sesame ginger dipping sauce and Szechuan slaw. Pizzas The Original BBQ Chicken: CPK's most-popular pizza, introduced in their first restaurant in Beverly Hills in 1985. Barbecue sauce, smoked gouda and mozzarella cheeses, BBQ chicken, sliced red onions, and cilantro. Carne Asada: Grilled steak, fire-roasted mild chilies, onions, cilantro pesto, Monterey Jack, and mozzarella cheeses. Topped with fresh tomato salsa and cilantro. Served with a side of tomatillo salsa. Thai Chicken: This is the original! Pieces of chicken breast marinated in a spicy peanut ginger and sesame sauce, mozzarella cheese, green onions, bean sprouts, julienne carrots, cilantro, and roasted peanuts. Milan: A combination of grilled spicy Italian sausage and sweet Italian sausage with sauted wild mushrooms, caramelized onions, fontina, mozzarella, and parmesan cheeses. Topped with fresh herbs. Pasta Shanghai Garlic Noodles: Chinese noodles wok-stirred in a garlic ginger sauce with snow peas, shiitake mushrooms, mild onions, red and yellow peppers, baby broccoli, and green onions. Also available with chicken and/or shrimp. Chicken Tequila Fettuccine: The original! Spinach fettuccine with chicken, red, green, and yellow peppers, red onions, and fresh cilantro in a tequila, lime, and jalapeo cream sauce. Source: California Pizza Kitchen Web site, http://www.cpk.com/menu (accessed on August 12, 2008). In addition to crediting its inventive menu, analysts also pointed out that its average check of $13.30 was below that of many of its upscale dining casual peers, such as P.F. Chang's and the Cheesecake Factory. Analysts from RBC Capital Markets labeled the chain a Price-Value-Experience leader in its sector. CPK spent 1% of its sales on advertising, far less than the 3% to 4% of sales that casual dining competitors, such as Chili's, Red Lobster, Olive Garden, and Outback Steakhouse, spent annually. Management felt careful execution of its company model resulted in devoted patrons who created free, but far more valuable word-of-mouth marketing for the company. Of the actual dollars spent on marketing, roughly 50% was spent on menu-development costs, with the other half consumed by more typical marketing strategies, such as public relations efforts, direct mail offerings, outdoor media, and on-line marketing. Page 394 CPK's clientele was not only attractive for its endorsements of the chain, but also because of its demographics. Management frequently highlighted that its core customer had an average household income of more than $75,000, according to a 2005 guest satisfaction survey. CPK contended that its customer base's relative affluence sheltered the company from macroeconomic pressures, such as high gas prices, that might lower sales at competitors with fewer well-off patrons. Restaurant Industry The restaurant industry could be divided into two main sectors: full service and limited service. Some of the most popular suhsectors within full service included casual dining and fine dining, with fast casual and fast food being the two prevalent limited-service subsectors, Restaurant consulting firn Technomic Information Services projected the limited-service restaurant segment to maintain a five-year compound annual growth rate (CAGR) of 5.5%, compared with 5.1% for the full-service restaurant segment. The five-year CAGR for CPK's subsector of the full-service segment was projected to grow even more at 6.5%. In recent years, a number of forces hud challenged restaurant industry executives, including: Increasing commodity prices: Higher labor costs, Softening demand due to high gas prices, Deteriorating housing wealth, and Intense interest in the industry by activist shareholders High gas prices not only affected demand for dining out, but also indirectly pushed a dramatic rise in food commodity prices. Moreover, a national call for the creation of more biofuels, primarily corn-produced ethanol, played an additional role in driving up food costs for the restaurant industry. Restaurant companies responded by raising menu prices in varying degrees. The restaurants believed that the price increases would have little impact on restaurant traffic given that consumers experienced higher price increases in their main alternative to dining out-purchasing food at grocery stores to consume at home. Restaurants not only had to deal with rising commodity costs, but also rising labor costs. In May 2007, President Bush signed legislation increasing the U.S. minimum wage rate over a three-year period beginning in July 2007 from $5.15 to $7.25 an hour. While restaurant management teams had time to prepare for the ramifications of this gradual increase, they were ill-equipped to deal with the nearly 20 states in late 2006 that passed anticipatory wage increases at rates higher than those proposed by Congress In addition to contending with the rising cost of goods sold (COGS), restaurants faced gross margins that were under pressure from the softening demand for dining out. A recent AAA Mid-Atlantic survey asked travelers how they Page 395 might reduce spending to make up for the elevated gas prices, and 52% answered that food expenses would be the first area to be cut. Despite that news, a Deutsche Bank analyst remarked, "Two important indicators of consumer health- disposable income and employment-are both holding up well. As long as people have jobs and incomes are rising, they are likely to continue to eat out." The current environment of elevated food and labor costs and consumer concems highlighted the differences between the limited service and full-service segments of the restaurant industry, Franchising was more popular in the limited service segment and provided some buffer against rising food and labor costs because franchisors received a percentage of gross siles, Royalties on gross sules also benefited from any pricing increases that were made to address higher costs, Restaurant companies with large franchising operations also did not have the huge amount of capital invested in locations or potentially heavy lease obligations associated with company-owned units. Some unalysts included operating lease requirements when considering a restaurant company's leverage 2 Analysts also believed limited-service restaurants would benefit from any consumers trading down from the casual dining sub-sector of the full-service sector. The growth of the fast-casual subsector and the food-quality improvements in fast food made trading down an increasing likelihood in an economic slowdown. The longer term outlook for overall restaurant demand looked much stronger. A study by the National Restaurant Association projected that consumers would increase the percentage of their food dollars spent on dining out from the 45% in recent years to 53% by 2010. That long-term positive trend muy huve helped explain the extensive interest in the restaurant industry by activist shareholders, often the executives of private equity firms and hedge funds. Activist investor William Ackman with Pershing Square Capital Management initiated the current round of activist investors forcing change at major restaurant chains. Roughly one week after Ackman vociferously criticized the McDonald's corporate organization at a New York investment conference in late 2005, the company declared it would divest 1,500 restaurants, repurchase $1 billion of its stock, and disclose more restaurant-level performance details. Ackman advocated all those changes and was able to leverage the power of his 4.5% stake in McDonald's hy using the media. His success did not go unnoticed, and other vocal minority investors aggressively pressed for changes at numerous chains including Applebee's, Wendy's, and Friendly's. These Paste 196 changes included the outright sale of the company, sales of noncore divisions, and closure of poor performing locations In response, other chains embarked on shareholder-friendly plans including initiating share repurchase programs, increasing dividends: decreasing corporate expenditures and divesting secondary assets. Doug Brooks, chief executive of Brinker International Inc., which owned Chili's noted at a recent conference: There is no shortage of interest in our industry these days, and much of the recent news has centered on the participation of activist shareholders... but it is my job as CEO to act as our internal activist. In April 2007, Brinker announced it had secured a new S400 million unsecured, committed credit facility to fund an accelerated share repurchase transaction in which approximately $300 million of its common stock would be repurchased. That followed a tenderoller recapitalization in 2006 in which the company repurchased $50 million worth of common shures, Recent Developments CPK's positive second-quarter results would affimm many analysts' conclusions that the company was a safe haven in the casual dining sector. Exhibits 32.2 and 32.3 contain CPK's financial statements through July 1, 2007. Exhibit 32.4 presents comparable store sales trends for CPK and peers. Exhibit 32.5 contains selected analysts forecasts for CPK, all of which anticipated revenue and earnings growth. A Morgan Keegan analyst commented in May: Despite increased market pressures on consumer spending, California Pizza Kitchen's concept continues to post impressive customer traffic gains. Traditionally appealing to a more discriminating, higher-income clicntclc, CPK's creative fare, low check average, and high service standards have uniquely positioned the concept for success in a tough consumer macroeconomic environment. As of 12/31/06 1/1/06 7/1/07 $ 8,187 $ 7,178 7.876 4.745 11,721 Assets Current assets Cash and cash equivalents Investments in marketable securities Other recevables Inventories Current deferred tax asset, net Prepaid Income tax Other prepaid expenses and other current assets Total current assets Property and equipment, net Noncurrent deferred tax asset, net Goodwill and other intangibles Other assets Total assets Llabilities and Shareholders' Equity Current liabilities Accounts payable Accrued compensation and benefits Accrued rent Deferred rent credits Other accrued liabilities Accrued Income tax Total current liabilities $ 11,272 11,408 4,109 3.776 8,437 1,428 5,492 45.922 213,408 4,513 5,967 4.444 $274,254 5,388 37.917 255,382 5.867 5,825 5,522 $310,513 10.709 4.596 11.834 8.769 6.444 49,530 271,867 6.328 5,754 6,300 $339,779 $ 7,054 13.068 13,253 4,056 9.294 $ 15,044 15.042 14,532 4.494 13,275 3.614 66,001 8,683 27,486 $ 14,115 15.572 14.979 5.135 13,980 9.012 72.793 8,662 32,436 46,725 5.383 24,810 Other liabilities Deferred rent credits, net of current portion Shareholders' equity: Common stock Additional paid-in-capital Accumulated deficit Accumulated comprehensive loss Total shareholders' equity Total liabilities and Shareholders' Equity 197 231,159 (34,013) 193 221.163 (13,013) 291 228.647 (3.050) 197,336 $274,254 208,343 $310,513 225.888 $339.779 Fiscal Year) 2004 2005 Three Months Ended 7/2/06 7/1/07 2003 2006 Restaurant sales Franchise and other revenues Total revenues Food, beverage and paper supplies Labor Direct operating and occupancy Cost of Sales General and administrative Depreciation and amortization Pre-opening costs Severance charges Loss on Impairment of PP&E Store closure costs Legal settlement reserve $356,260 $418,799 $474.738 $547.968 $134,604 $156,592 3,627 3,653 4,861 6,633 1,564 1.989 359.887 422,452 479,599 554,601 136,168 158,581 87,806 103,813 118,480 135,848 33,090 38,426 129,702 152.949173.751 199.744 49,272 56.912 70,273 83,054 92.827 108,558 26,214 30.773 287.781 339.816 385,058444,150 108,576 126,111 21,488 28,794 36,298 43.320 11,035 12,206 20.714 23.975 25.440 29,489 7,070 9,022 4.147 737 4,051 6,964 800 852 1,221 18,984 1,160 2,700 152 707 768 600 5,552 25,097 26,840 29.971 8,687 9,622 317571 739 718 287 91 1.105 (349) (143) 1 (22) (32) 428 1,822 718 287 91 5.520 25,525 28,662 30,689 8,974 9,713 (82) 7.7099,172 9,689 2,9613,393 $ 5,602 $ 17,816 $ 19,490 $ 21,000 $ 6,013 $ 6,320 1,333 Operating income Interest Income Other Income Equity in loss of unconsolidated JV Total other Income (expense) Income before income tax provision Income tax provision (benefit) Net Income Net Income per common share: Basic Diluted Selected Operating Data: Restaurants open at end of period Company-owned open at end of period Avg weekly full service rest. sales 18-mo. comparable rest sales growth $ $ 0.30 0.29 $ $ 0.93 $ 0.92 $ 1.01 $ 0.99 $ 1.08 $ 1.06 $ 0.20 $ 0.20 $ 0.22 0.21 162 168 171 188 205 193 213 137 157 176 182 $ 54,896 $ 57,509 $ 62.383 $ 65,406 $ 65,427 $ 68.535 3.4% 8.0% 7.5% 5.9% 4.8% 5.4% CY05 Q4 6.4% 6.9% California Pizza Kitchen Applebee's International, Inc. BJ's Restaurants, Inc. Brinker International The Cheesecake Factory, Inc. Chipotle Mexican Grill, Inc. Darden Restaurants, Inc.-Red Lobster Darden Restaurants, Inc.-Olive Garden McCormick & Schmick's Seafood Restaurants, Inc. Panera Bread Company P. F. Chang's China Bistro RARE-Longhorn Steakhouse Red Robin Gourmet Burgers Ruth's Chris Steak House, Inc. Sonic Corporation Texas Roadhouse, Inc. CYO3 3.4% 4.1% 3.3% 2.1% 0.7% 24.4% 0.0% 2.2% 1.1% 0.2% 5.1% 4.6% 4.1% 1.4% 1.6% 3.5% CY04 9.3% 4.8% 4.0% 1.9% 3.9% 13.3% -3.9% 4.7% 3.8% 2.7% 3.0% 5.0% 7.5% 11.6% 7.0% 7.6% 1.8% 4.6% 3.2% 1.7% 10.2% 4.2% 8.6% 3.0% 7.8% 1.2% 2.8% 3.8% 10.4% 5.4% 5.6% Q1 4.8% 2.6% 6.8% 2.7% -1.3% 19.7% 1.6% 5.7% 4.1% 9.0% 1.3% 3.7% 4.8% 6.8% 5.5% 6.4% Q2 5.9% -1.8% 5.9% -2.0% -0.8% 14.5% 9.4% 2.5% 2.8% 3.2% -1.0% -0.4% CYO6 Q3 5.6% -2.3% 5.3% -2.1% -1.6% 11.6% -2.1% 2.9% 2.9% 2.8% -0.5% -0.3% 0.8% 4.3% 4.0% 2.3% -1.1% 5.5% -2.1% 0.8% 10.1% 0.7% 2.9% 2.0% 2.0% -0.9% 1.5% 0.2% 7.4% 3.4% 3.3% CYO7 Q1 4.7% -4.0% 6.9% -4.4% 0.4% 8.3% 4.6% 1.0% 2.8% 0.0% -2.5% -1.0% -0.5% 1.9% 2.0% 0.9% 3.3% 6.0% 4.3% 1.2% 2007E 2008E 2009E Date of Report Price Target Firm Revenues EPS Revenues EPS Revenues EPS $40 NA 37 NA Oppenheimer and Co. Inc. CIBC World Markets KeyBanc Capital Markets RBC Capital Markets Morgan Keegan & Co., Inc. MKM Partners NA 4/9/07 4/12/07 5/11/07 5/11/07 5/11/07 5/11/07 $652.9 647.5 NA 650.7 644.2 647.5 $1.33 1.29 1.28 1.31 1.33 1.34 NA 755.1 NA 753.1 742.1 754.3 NA 1.57 1.55 1.59 1.58 1.69 NA 878.2 NA NA NA 1.90 NA NA NA NA While other restaurant companies experienced weakening sales and earnings growth, CPK's revenues increased more than 16% to $159 million for the second quarter of 2007. Notably, royalties from the Kraft partnership and international franchises were up 37% and 21%, respectively, for the second quarter. Development plans for opening a total of 16 to 18 new locations remained on schedule for 2007. Funding CPK's 2007 growth plan was anticipated to require $85 million in capital expenditures. The company was successfully managing its two largest expense items in an environment of rising labor and food costs. Labor costs had actually declined from 36.6% to 36.3% of total revenues from the second quarter of 2006 to the second quarter of 2007. Food, beverage, and paper-supply costs remained constant at roughly 24.5% of total revenue in both the second quarter of 2006 and 2007. The company was implementing a number of taskforce initiatives to deal with the Page 397 commodity price pressures, especially as cheese prices increased from $1.37 per pound in April to almost $2.00 a pound by the first week of July. Management felt that much of the cost improvements had been achieved through enhancements in restaurant operations. Capital Structure Decision CPK's book equity was expected to be around $226 million at the end of the second quarter. With a share price in the low 20s, CPK's market capitalization stood at $644 million. The company had recently issued a 50% stock dividend, which had effectively split CPK shares on a 3-for-2 shares basis. CPK investors received one additional share for every two shares of common stock held. Adjusted for the stock dividend, Exhibit 32.6 shows the performance of CPK stock relative to that of industry peers. EXHIBIT 32.6 I Stock Price Comparison Value of $100 Invested in CPK and S&P SmallCap 600 Restaurants Index $140 $130 $120 $110 S&P SmallCap 600 Restaurants $100 $90 $80 4/3/2007 3/3/2007 5/3/2007 6/3/2007 Note: Adjusted for the June 2007 50% stock dividend. With such a dividend, an owner of two shares of CPK stock was given an additional share. The effect was to increase CPK shares by one-third, yet maintain the overall capitalization of the equity. Sources of data: Yahoo! Finance and Datastream. 7/3/2006 8/3/2006 9/3/2006 10/3/2006 11/3/2006 12/3/2006 1/3/2007 2/3/2007 Despite the challenges of growing the number of restaurants by 38% over the last five years, CPK consistently generated strong operating returns. CPK's return on equity (ROE), which was 10.1% for 2006, did not benefit from financial leverage..4 Financial policy varied across the industry, with some firms remaining all equity capitalized and others levering up to half debt financing. Exhibit 32.7 depicts selected financial data for peer firms. Because CPK used the proceeds from its 2000 initial public offering (IPO) to pay off its outstanding debt, the company completely avoided debt financing. CPK maintained borrowing capacity available under an existing $75 million line of credit. Interest on the line of credit was calculated at LIBOR plus 0.80%. With LIBOR currently at 5.36%, the line of credit's interest rate was 6.16% (see Exhibit 32.8). Fiscal Year End Month 7/2/2007 Share Price EBITDA Margin Net Profit Margin Earnings per Share Dividends per Share Book Value per Share Revenue Beta $ 0.00 Dec. Dec 0.20 Dec 0.85 0.80 1.05 0.90 1.10 1.00 June Dec California Pizza Kitchen Applebee's International, Inc. BJ's Restaurants, Inc. Brinker International Buffalo Wild Wings, Inc. The Cheesecake Factory, Inc. Chipotle Mexican Grill, Inc. Darden Restaurants, Inc. Frisch's Restaurants, Inc. McCormick & Schmick's Panera Bread Company P.F. Chang's China Bistro RARE Hospitality Int'l Inc. Red Robin Gourmet Burgers Ruth's Chris Steak House, Inc. Sonic Corporation Texas Roadhouse, Inc. Dec. Dec. May May NA $22.10 24.28 20.05 29.37 41.78 24.57 86.00 44.14 30.54 25.66 46.02 35.37 26.76 40.19 16.80 22.00 12.81 $55 1,338 239 4,151 278 1,315 823 5,721 291 308 829 938 987 10.7% 15.9% 9.6% 12.0% 13.3% 12.2% 13.0% 13.2% 31.6% 9.7% 16.3% 10.5% 11.6% 13.7% 15.6% 24.9% 12.5% 3.8% 6.5% 4.1% 4.7% 5.8% 6.2% 5.0% 5.9% 3.1% 4.3% 7.2% 3.6% 5.1% 4.9% 8.7% 11.4% 5.7% $0.71 1.17 0.41 1.49 0.93 1.02 1.28 2.16 1.78 0.92 1.87 1.24 1.45 1.82 1.01 0.00 0.20 0.00 0.00 0.00 0.40 0.44 0.00 0.00 $7.20 6.49 7.78 8.59 6.61 9.09 14.56 8.37 19.84 11.20 12.53 11.41 11.17 14.68 2.93 4.66 4.30 Dec 1.00 0.60 1.10 1.25 1.10 0.57 1.05 Dec Dec Dec. Dec Dec Aug. Dec 0.00 619 272 0.00 0.00 0.00 0.00 0.00 NA 0.88 693 597 0.90 0.90 0.44 Current Assets Total Debt Share Equity Debt Capital Interest Coverage Total Capital Turnover Current Liabilities $ 66 187 $ 38 $ 0 175 2.7 105 96 242 36 502 75 497 26 163 $ 208 487 203 1,076 116 712 474 1.230 101 203 179 61 California Pizza Kitchen Applebee's International, Inc. BJ's Restaurants, Inc. Brinker International Buffalo Wild Wings, Inc. The Cheesecake Factory, Inc. Chipotle Mexican Grill, Inc. Darden Restaurants, Inc. Frisch's Restaurants, Inc. McCormick & Schmick's Panera Bread Company P.F. Chang's China Bistro RARE Hospitality Int'l Inc. Red Robin Gourmet Burgers Ruth's Chris Steak House, Inc. Sonic Corporation Texas Roadhouse, Inc. 378 645 Return on Capital Equity 10.1% 10.1% 14.0% 18.0% 4.9% 4.9% 13.2% 18.0% 14.0% 14.0% 11.4% 11.4% 8.8% 8.7% 20.6% 27.5% 7.9% 9.1% 8.3% 8.3% 15.1% 15.1% 11.1% 11.5% 9.8% 13.9% 9.3% 12.5% 18.6% 34.9% 15.3% 20.1% 9.7% 10.7% 12 0.0% 26.5% 0.0% 31.8% 0.0% 0.0% 0.0% 34.4% 30.1% 0.2% 0.0% 6.2% 31.6% 31.9% 50.0% 28.9% 10.2% 1,026 31 40 110 NMF 11.7 NME 14.4 NME NME NMF 10.9 5.9 NMF NME NMF 29.2 7.7 12.8 15.0 19.9 30 160 128 166 114 398 290 360 244 68 68 159 36 392 319 2000 30-year 5.94% 5.49% 2001 Average LIBOR 3-month 6.55% 3.63% 1.79% 1.22% 1.67% 3.63% 3-month 5.85% 3.45% 1.62% 1.02% 1.38% 3.16% 2002 2003 2004 2005 2006: Jan. Feb. Mar. Apr. May. June July Aug. Sept. Oct. Nov. Dec. 2007: Jan 4.20% 4.41% 4.51% 4.59% 4.72% 4.79% 4.96% 4.98% 4.82% 4.89% 4.95% 4.85% U.S. Treasury Securities Notes & Bonds 6-month 3-year 10-year 5.92% 6.22% 6.03% 3.39% 4.09% 5.02% 1.69% 3.10% 4.61% 1.06% 2.10% 4.01% 1.58% 2.78% 4.27% 3.40% 3.93% 4.29% 4.30% 4.35% 4.42% 4.51% 4.64% 4.57% 4.61% 4.74% 4.72% 4.72% 4.89% 4.99% 4.81% 4.97% 5.11% 4.95% 5.09% 5.11% 5.09% 5.07% 5.09% 4.99% 4.85% 4.88% 4.90% 4.69% 4.72% 4.91% 4.72% 4.73% 4.96% 4.64% 4.60% 4.88% 4.58% 4.56% 4.94% 4.79% 4.76% 4.97% 4.75% 4.72% 4.90% 4.51% 4.56% 4.87% 4.60% 4.69% 4.80% 4.69% 4.75% 4.77% 5.00% 5.10% 4.54% 4.73% 5.06% 5.20% 5.15% 5.13% 5.00% 4.85% 4.85% 4.69% 4.68% 4.85% 4.82% 4.72% 4.87% 4.90% 5.20% Corporate bonds (Moody's) Aaa 3 Baa 7.62% 8.36% 7.08% 7.95% 6.49% 7.80% 5.67% 6.77% 5.63% 6.39% 5.24% 6.06% 5.29% 6.24% 5.35% 6.27% 5.53% 6.41% 5.84% 6.68% 5.95% 6.75% 5.89% 6.78% 5.85% 6.76% 5.68% 6.59% 5.51% 6.43% 5.51% 6.42% 5.33% 6.20% 5.32% 6.22% 5.40% 6.34% 5.39% 6.28% 5.30% 6.27% 5.47% 6.39% 5.47% 6.39% 5.79% 6.70% Average Prime Lending 9.23% 6.91% 4.67% 4.12% 4.34% 6.19% 7.38% 7.50% 7.63% 7.75% 7.88% 7.13% 8.25% 8.25% 8.25% 8.25% 8.25% 8.25% 8.25% 8.25% 8.25% 8.25% 8.25% 8.25% 4.68% 4.82% 4.99% 5.15% 5.23% 5.51% 5.49% 5.40% 5.37% 5.37% 5.37% 5.36% 5.36% 5.36% 5.35% 5.36% 5.36% 5.36% Feb. Mar. Apr. 4.96% 5.02% 4.97% 4.88% 4.77% 4.63% May. June The recent 10% share price decline seemed to raise the question of whether this was an ideal time to repurchase shares and potentially leverage the company's balance sheet with ample borrowings available on its existing line of credit. One gain from the leverage would be to reduce the corporate income tax liability, which had been almost $10 million in 2006. Exhibit 32.9 provides pro forma financial summaries of CPK's tax shield under alternative capital structures. Still, CPK needed to preserve its ability to fund the strong expansion outlined for the company. Any use of financing to return capital to shareholders needed to be balanced with management's goal of growing the business. Debt/Total Capital 20% Actual 10% 30% 6.16% 32.5% 6.16% 32.5% 30,054 Interest rate (1) Tax rate Earnings before income taxes and Interest Interest expense Earnings before taxes Income taxes Net Income Book value: Debt Equity Total capital Market value: Debt 6.16% 32.5% 30.054 1.391 28,663 9,303 19.359 6.16% 32.5% 30,054 4.174 25,880 8.400 17.480 30,054 2,783 27,271 8.852 18,419 30,054 9.755 20,299 225,888 225.888 22,589 203,299 225,888 45,178 180,710 225,888 67.766 158,122 225.888 Equity 22,589 628,516 651,105 643.773 643.773 45,178 613,259 658,437 67.766 598,002 665,769 Market value of capital EXHIBIT 32.9 1 Pro Forma Tax Shield Effect of Recapitalization Scenarios (dollars in thousands, except share data; figures based on end of June 2007) Notes: (1) Interest rate of CPK's credit facility with Bank of America: LIBOR + 0.80%. (2) Earnings before interest and taxes (EBIT) include interest income. (3) Market values of debt equal book values. (4) Actual market value of equity equals the share price ($22.10) multiplied by the current number of shares outstanding (29.13 million). Source: Case writer analysis based on CPK financial data. CASE 32 California Pizza Kitchen Everyone knows that 95% of restaurants fail in the first two years, and a lot of people think it's "location, location, location." It could be, but my experience is you have to have the financial staying power. You could have the greatest idea, but many restaurants do not start out making money-they build over time. So it's really about having the capital and the staying power. - Rick Rosenfield, Co-CEO, California Pizza Kitchen In early July 2007, the financial team at California Pizza Kitchen (CPK), led by Chief Financial Officer Susan Collyns, was compiling the preliminary results for the second quarter of 2007. Despite industry challenges of rising commodity, labor, and energy costs, CPK was about to announce near-record quarterly profits of over $6 million. CPK's profit expansion was explained by strong revenue growth with comparable restaurant sales up over 5%. The announced numbers were fully in line with the company's forecasted guidance to investors. The company's results were particularly impressive when contrasted with many other casual dining firms, which had experienced sharp declines in customer traffic. Despite the strong performance, industry difficulties were such that CPK's share price had declined 10% during the month of June to a current value of $22.10. Given the price drop, the management team had discussed repurchasing company shares. With little money in excess cash, however, a large share repurchase program would require debt financing. Since going public in 2000, CPK's management had avoided putting any debt on the balance sheet. Financial policy was conservative to preserve what co-CEO Rick Rosenfeld referred to as staying power. The view was that a strong balance sheet would maintain the borrowing ability needed to support CPK's expected growth trajectory. Yet with interest rates on the rise from historical lows, Collyns was aware of the benefits of moderately levering up CPK's equity. California Pizza Kitchen Inspired by the gourmet pizza offerings at Wolfgang Puck's celebrity-filled restaurant, Spago, and eager to flee their careers as white-collar criminal defense attorneys, Larry Flax and Rick Rosenfield created the first California Pizza Kitchen in 1985 in Beverly Hills, California. Known for its hearth-baked barbecue-chicken pizza, the designer pizza at off-the-rack prices concept flourished. Expansion across the state, country, and globe followed in the subsequent two decades. At the end of the second quarter of 2007, the company had 213 locations in 28 states and 6 foreign countries. While still very California-centric (approximately 41% of the U.S. stores were in California), the casual dining model had done well throughout all U.S. regions with its family-friendly surroundings, excellent ingredients, and inventive offerings. California Pizza Kitchen derived its revenues from three sources: sales at company-owned restaurants, royalties from franchised restaurants, and royalties from a partnership with Kraft Foods to sell CPK-branded frozen pizzas in grocery stores. While the company had expanded beyond its original concept with two other restaurant brands, its main focus remained on operating company-owned full-service CPK restaurants, of which there were 170 units. Analysts conservatively estimated the potential for full-service company-owned CPK units at 500. Both the investment community and management were less certain about the potential for the company's chief attempt at brand extension, its ASAP restaurant concept. In 1996, the company first developed the ASAP concept in a franchise agreement with HMSHost. The franchised ASAPs were located in airports and featured a limited selection of pizzas and grab-n-go salads and sandwiches. While not a huge revenue source, management was pleased with the success of the airport ASAP locations, which currently numbered 16. In early 2007, HMS Host and CPK agreed to extend their partnership through 2012. But the sentiment was more mixed regarding its company-owned ASAP locations. First opened in 2000 to capitalize on the growth of fast casual dining, the company-owned ASAP units offered CPK's most-popular pizzas, salads, soups, and sandwiches with in-restaurant seating. Sales and operations at the company-owned ASAP units never met management's expectations. Even after retooling the concept and restaurant prototype in 2003, management decided to halt indefinitely all ASAP development in 2007 and planned to record roughly $770,000 in expenses in the second quarter to terminate the planned opening of one ASAP location. Although they had doubts associated with the company-owned ASAP restaurant chain, the company and investment community were upbeat about CPK's success and prospects with franchising full-service restaurants internationally. At the beginning of July 2007, the company had 15 franchised international locations, with more openings planned for the second half of 2007. Management sought out knowledgeable franchise partners who would protect the company's brand and were capable of growing the number of international units. Franchising agreements typically gave CPK an initial payment of $50,000 to $65,000 for each location opened and then an estimated 5% of gross sales. With locations already in China (including Hong Kong), Indonesia, Japan, Malaysia, the Philippines, and Singapore, the company planned to expand its global reach to Mexico and South Korea in the second half of 2007. Management saw its Kraft partnership as another initiative in its pursuit of building a global brand. In 1997, the company entered into a licensing agreement with Kraft Foods to distribute CPK-branded frozen pizzas. Although Page 393 representing less than 1% of current revenues, the Kraft royalties had a 95% pretax margin, one equity analyst estimated. In addition to the high-margin impact on the company's bottom line, management also highlighted the marketing requirement in its Kraft partnership. Kraft was obligated to spend 5% of gross sales on marketing the CPK frozen pizza brand, more than the company often spent on its own marketing. Management believed its success in growing both domestically and internationally, and through ventures like the Kraft partnership, was due in large part to its "dedication to guest satisfaction and menu innovation and sustainable culture of two co-founders still heading the menu-development team. Exhibit 32.1 contains a selection of CPK menu offerings. Its menu items offer customers distinctive, compelling flavors to commonly recognized foods, A Morgan Keegan analyst wrote. While the company had a narrower, more-focused menu than some of its peers, the chain prided itself on creating craved items, such as Singapore Shrimp Rolls, that distinguished its menu and could not be found at its casual dining peers. This strategy was successful, and internal research indicated a specific menu craving that could not be satisfied elsewhere prompted many patron visits. To maintain the menu's originality, management reviewed detailed sales reports twice a year and replaced slow-selling offerings with new items. Some of the company's most recent menu additions in 2007 had been developed and tested at the company's newest restaurant concept, the LA Food Show. Created by Flax and Rosenfield in 2003, the LA Food Show offered a more upscale experience and expansive menu than CPK. CPK increased its minority interest to full ownership of the LA Food Show in 2005 and planned to open a second location in early 2008. Appetizers Avocado Club Egg Rolls: A fusion of East and West with fresh avocado, chicken, tomato, Monterey Jack cheese, and applewood smoked bacon, wrapped in a crispy wonton roll. Served with ranchito sauce and herb ranch dressing. Singapore Shrimp Rolls: Shrimp, baby broccoli, soy-glazed shiitake mushrooms, romaine, carrots, noodles, bean sprouts, green onion, and cilantro wrapped in rice paper. Served chilled with a sesame ginger dipping sauce and Szechuan slaw. Pizzas The Original BBQ Chicken: CPK's most-popular pizza, introduced in their first restaurant in Beverly Hills in 1985. Barbecue sauce, smoked gouda and mozzarella cheeses, BBQ chicken, sliced red onions, and cilantro. Carne Asada: Grilled steak, fire-roasted mild chilies, onions, cilantro pesto, Monterey Jack, and mozzarella cheeses. Topped with fresh tomato salsa and cilantro. Served with a side of tomatillo salsa. Thai Chicken: This is the original! Pieces of chicken breast marinated in a spicy peanut ginger and sesame sauce, mozzarella cheese, green onions, bean sprouts, julienne carrots, cilantro, and roasted peanuts. Milan: A combination of grilled spicy Italian sausage and sweet Italian sausage with sauted wild mushrooms, caramelized onions, fontina, mozzarella, and parmesan cheeses. Topped with fresh herbs. Pasta Shanghai Garlic Noodles: Chinese noodles wok-stirred in a garlic ginger sauce with snow peas, shiitake mushrooms, mild onions, red and yellow peppers, baby broccoli, and green onions. Also available with chicken and/or shrimp. Chicken Tequila Fettuccine: The original! Spinach fettuccine with chicken, red, green, and yellow peppers, red onions, and fresh cilantro in a tequila, lime, and jalapeo cream sauce. Source: California Pizza Kitchen Web site, http://www.cpk.com/menu (accessed on August 12, 2008). In addition to crediting its inventive menu, analysts also pointed out that its average check of $13.30 was below that of many of its upscale dining casual peers, such as P.F. Chang's and the Cheesecake Factory. Analysts from RBC Capital Markets labeled the chain a Price-Value-Experience leader in its sector. CPK spent 1% of its sales on advertising, far less than the 3% to 4% of sales that casual dining competitors, such as Chili's, Red Lobster, Olive Garden, and Outback Steakhouse, spent annually. Management felt careful execution of its company model resulted in devoted patrons who created free, but far more valuable word-of-mouth marketing for the company. Of the actual dollars spent on marketing, roughly 50% was spent on menu-development costs, with the other half consumed by more typical marketing strategies, such as public relations efforts, direct mail offerings, outdoor media, and on-line marketing. Page 394 CPK's clientele was not only attractive for its endorsements of the chain, but also because of its demographics. Management frequently highlighted that its core customer had an average household income of more than $75,000, according to a 2005 guest satisfaction survey. CPK contended that its customer base's relative affluence sheltered the company from macroeconomic pressures, such as high gas prices, that might lower sales at competitors with fewer well-off patrons. Restaurant Industry The restaurant industry could be divided into two main sectors: full service and limited service. Some of the most popular suhsectors within full service included casual dining and fine dining, with fast casual and fast food being the two prevalent limited-service subsectors, Restaurant consulting firn Technomic Information Services projected the limited-service restaurant segment to maintain a five-year compound annual growth rate (CAGR) of 5.5%, compared with 5.1% for the full-service restaurant segment. The five-year CAGR for CPK's subsector of the full-service segment was projected to grow even more at 6.5%. In recent years, a number of forces hud challenged restaurant industry executives, including: Increasing commodity prices: Higher labor costs, Softening demand due to high gas prices, Deteriorating housing wealth, and Intense interest in the industry by activist shareholders High gas prices not only affected demand for dining out, but also indirectly pushed a dramatic rise in food commodity prices. Moreover, a national call for the creation of more biofuels, primarily corn-produced ethanol, played an additional role in driving up food costs for the restaurant industry. Restaurant companies responded by raising menu prices in varying degrees. The restaurants believed that the price increases would have little impact on restaurant traffic given that consumers experienced higher price increases in their main alternative to dining out-purchasing food at grocery stores to consume at home. Restaurants not only had to deal with rising commodity costs, but also rising labor costs. In May 2007, President Bush signed legislation increasing the U.S. minimum wage rate over a three-year period beginning in July 2007 from $5.15 to $7.25 an hour. While restaurant management teams had time to prepare for the ramifications of this gradual increase, they were ill-equipped to deal with the nearly 20 states in late 2006 that passed anticipatory wage increases at rates higher than those proposed by Congress In addition to contending with the rising cost of goods sold (COGS), restaurants faced gross margins that were under pressure from the softening demand for dining out. A recent AAA Mid-Atlantic survey asked travelers how they Page 395 might reduce spending to make up for the elevated gas prices, and 52% answered that food expenses would be the first area to be cut. Despite that news, a Deutsche Bank analyst remarked, "Two important indicators of consumer health- disposable income and employment-are both holding up well. As long as people have jobs and incomes are rising, they are likely to continue to eat out." The current environment of elevated food and labor costs and consumer concems highlighted the differences between the limited service and full-service segments of the restaurant industry, Franchising was more popular in the limited service segment and provided some buffer against rising food and labor costs because franchisors received a percentage of gross siles, Royalties on gross sules also benefited from any pricing increases that were made to address higher costs, Restaurant companies with large franchising operations also did not have the huge amount of capital invested in locations or potentially heavy lease obligations associated with company-owned units. Some unalysts included operating lease requirements when considering a restaurant company's leverage 2 Analysts also believed limited-service restaurants would benefit from any consumers trading down from the casual dining sub-sector of the full-service sector. The growth of the fast-casual subsector and the food-quality improvements in fast food made trading down an increasing likelihood in an economic slowdown. The longer term outlook for overall restaurant demand looked much stronger. A study by the National Restaurant Association projected that consumers would increase the percentage of their food dollars spent on dining out from the 45% in recent years to 53% by 2010. That long-term positive trend muy huve helped explain the extensive interest in the restaurant industry by activist shareholders, often the executives of private equity firms and hedge funds. Activist investor William Ackman with Pershing Square Capital Management initiated the current round of activist investors forcing change at major restaurant chains. Roughly one week after Ackman vociferously criticized the McDonald's corporate organization at a New York investment conference in late 2005, the company declared it would divest 1,500 restaurants, repurchase $1 billion of its stock, and disclose more restaurant-level performance details. Ackman advocated all those changes and was able to leverage the power of his 4.5% stake in McDonald's hy using the media. His success did not go unnoticed, and other vocal minority investors aggressively pressed for changes at numerous chains including Applebee's, Wendy's, and Friendly's. These Paste 196 changes included the outright sale of the company, sales of noncore divisions, and closure of poor performing locations In response, other chains embarked on shareholder-friendly plans including initiating share repurchase programs, increasing dividends: decreasing corporate expenditures and divesting secondary assets. Doug Brooks, chief executive of Brinker International Inc., which owned Chili's noted at a recent conference: There is no shortage of interest in our industry these days, and much of the recent news has centered on the participation of activist shareholders... but it is my job as CEO to act as our internal activist. In April 2007, Brinker announced it had secured a new S400 million unsecured, committed credit facility to fund an accelerated share repurchase transaction in which approximately $300 million of its common stock would be repurchased. That followed a tenderoller recapitalization in 2006 in which the company repurchased $50 million worth of common shures, Recent Developments CPK's positive second-quarter results would affimm many analysts' conclusions that the company was a safe haven in the casual dining sector. Exhibits 32.2 and 32.3 contain CPK's financial statements through July 1, 2007. Exhibit 32.4 presents comparable store sales trends for CPK and peers. Exhibit 32.5 contains selected analysts forecasts for CPK, all of which anticipated revenue and earnings growth. A Morgan Keegan analyst commented in May: Despite increased market pressures on consumer spending, California Pizza Kitchen's concept continues to post impressive customer traffic gains. Traditionally appealing to a more discriminating, higher-income clicntclc, CPK's creative fare, low check average, and high service standards have uniquely positioned the concept for success in a tough consumer macroeconomic environment. As of 12/31/06 1/1/06 7/1/07 $ 8,187 $ 7,178 7.876 4.745 11,721 Assets Current assets Cash and cash equivalents Investments in marketable securities Other recevables Inventories Current deferred tax asset, net Prepaid Income tax Other prepaid expenses and other current assets Total current assets Property and equipment, net Noncurrent deferred tax asset, net Goodwill and other intangibles Other assets Total assets Llabilities and Shareholders' Equity Current liabilities Accounts payable Accrued compensation and benefits Accrued rent Deferred rent credits Other accrued liabilities Accrued Income tax Total current liabilities $ 11,272 11,408 4,109 3.776 8,437 1,428 5,492 45.922 213,408 4,513 5,967 4.444 $274,254 5,388 37.917 255,382 5.867 5,825 5,522 $310,513 10.709 4.596 11.834 8.769 6.444 49,530 271,867 6.328 5,754 6,300 $339,779 $ 7,054 13.068 13,253 4,056 9.294 $ 15,044 15.042 14,532 4.494 13,275 3.614 66,001 8,683 27,486 $ 14,115 15.572 14.979 5.135 13,980 9.012 72.793 8,662 32,436 46,725 5.383 24,810 Other liabilities Deferred rent credits, net of current portion Shareholders' equity: Common stock Additional paid-in-capital Accumulated deficit Accumulated comprehensive loss Total shareholders' equity Total liabilities and Shareholders' Equity 197 231,159 (34,013) 193 221.163 (13,013) 291 228.647 (3.050) 197,336 $274,254 208,343 $310,513 225.888 $339.779 Fiscal Year) 2004 2005 Three Months Ended 7/2/06 7/1/07 2003 2006 Restaurant sales Franchise and other revenues Total revenues Food, beverage and paper supplies Labor Direct operating and occupancy Cost of Sales General and administrative Depreciation and amortization Pre-opening costs Severance charges Loss on Impairment of PP&E Store closure costs Legal settlement reserve $356,260 $418,799 $474.738 $547.968 $134,604 $156,592 3,627 3,653 4,861 6,633 1,564 1.989 359.887 422,452 479,599 554,601 136,168 158,581 87,806 103,813 118,480 135,848 33,090 38,426 129,702 152.949173.751 199.744 49,272 56.912 70,273 83,054 92.827 108,558 26,214 30.773 287.781 339.816 385,058444,150 108,576 126,111 21,488 28,794 36,298 43.320 11,035 12,206 20.714 23.975 25.440 29,489 7,070 9,022 4.147 737 4,051 6,964 800 852 1,221 18,984 1,160 2,700 152 707 768 600 5,552 25,097 26,840 29.971 8,687 9,622 317571 739 718 287 91 1.105 (349) (143) 1 (22) (32) 428 1,822 718 287 91 5.520 25,525 28,662 30,689 8,974 9,713 (82) 7.7099,172 9,689 2,9613,393 $ 5,602 $ 17,816 $ 19,490 $ 21,000 $ 6,013 $ 6,320 1,333 Operating income Interest Income Other Income Equity in loss of unconsolidated JV Total other Income (expense) Income before income tax provision Income tax provision (benefit) Net Income Net Income per common share: Basic Diluted Selected Operating Data: Restaurants open at end of period Company-owned open at end of period Avg weekly full service rest. sales 18-mo. comparable rest sales growth $ $ 0.30 0.29 $ $ 0.93 $ 0.92 $ 1.01 $ 0.99 $ 1.08 $ 1.06 $ 0.20 $ 0.20 $ 0.22 0.21 162 168 171 188 205 193 213 137 157 176 182 $ 54,896 $ 57,509 $ 62.383 $ 65,406 $ 65,427 $ 68.535 3.4% 8.0% 7.5% 5.9% 4.8% 5.4% CY05 Q4 6.4% 6.9% California Pizza Kitchen Applebee's International, Inc. BJ's Restaurants, Inc. Brinker International The Cheesecake Factory, Inc. Chipotle Mexican Grill, Inc. Darden Restaurants, Inc.-Red Lobster Darden Restaurants, Inc.-Olive Garden McCormick & Schmick's Seafood Restaurants, Inc. Panera Bread Company P. F. Chang's China Bistro RARE-Longhorn Steakhouse Red Robin Gourmet Burgers Ruth's Chris Steak House, Inc. Sonic Corporation Texas Roadhouse, Inc. CYO3 3.4% 4.1% 3.3% 2.1% 0.7% 24.4% 0.0% 2.2% 1.1% 0.2% 5.1% 4.6% 4.1% 1.4% 1.6% 3.5% CY04 9.3% 4.8% 4.0% 1.9% 3.9% 13.3% -3.9% 4.7% 3.8% 2.7% 3.0% 5.0% 7.5% 11.6% 7.0% 7.6% 1.8% 4.6% 3.2% 1.7% 10.2% 4.2% 8.6% 3.0% 7.8% 1.2% 2.8% 3.8% 10.4% 5.4% 5.6% Q1 4.8% 2.6% 6.8% 2.7% -1.3% 19.7% 1.6% 5.7% 4.1% 9.0% 1.3% 3.7% 4.8% 6.8% 5.5% 6.4% Q2 5.9% -1.8% 5.9% -2.0% -0.8% 14.5% 9.4% 2.5% 2.8% 3.2% -1.0% -0.4% CYO6 Q3 5.6% -2.3% 5.3% -2.1% -1.6% 11.6% -2.1% 2.9% 2.9% 2.8% -0.5% -0.3% 0.8% 4.3% 4.0% 2.3% -1.1% 5.5% -2.1% 0.8% 10.1% 0.7% 2.9% 2.0% 2.0% -0.9% 1.5% 0.2% 7.4% 3.4% 3.3% CYO7 Q1 4.7% -4.0% 6.9% -4.4% 0.4% 8.3% 4.6% 1.0% 2.8% 0.0% -2.5% -1.0% -0.5% 1.9% 2.0% 0.9% 3.3% 6.0% 4.3% 1.2% 2007E 2008E 2009E Date of Report Price Target Firm Revenues EPS Revenues EPS Revenues EPS $40 NA 37 NA Oppenheimer and Co. Inc. CIBC World Markets KeyBanc Capital Markets RBC Capital Markets Morgan Keegan & Co., Inc. MKM Partners NA 4/9/07 4/12/07 5/11/07 5/11/07 5/11/07 5/11/07 $652.9 647.5 NA 650.7 644.2 647.5 $1.33 1.29 1.28 1.31 1.33 1.34 NA 755.1 NA 753.1 742.1 754.3 NA 1.57 1.55 1.59 1.58 1.69 NA 878.2 NA NA NA 1.90 NA NA NA NA While other restaurant companies experienced weakening sales and earnings growth, CPK's revenues increased more than 16% to $159 million for the second quarter of 2007. Notably, royalties from the Kraft partnership and international franchises were up 37% and 21%, respectively, for the second quarter. Development plans for opening a total of 16 to 18 new locations remained on schedule for 2007. Funding CPK's 2007 growth plan was anticipated to require $85 million in capital expenditures. The company was successfully managing its two largest expense items in an environment of rising labor and food costs. Labor costs had actually declined from 36.6% to 36.3% of total revenues from the second quarter of 2006 to the second quarter of 2007. Food, beverage, and paper-supply costs remained constant at roughly 24.5% of total revenue in both the second quarter of 2006 and 2007. The company was implementing a number of taskforce initiatives to deal with the Page 397 commodity price pressures, especially as cheese prices increased from $1.37 per pound in April to almost $2.00 a pound by the first week of July. Management felt that much of the cost improvements had been achieved through enhancements in restaurant operations. Capital Structure Decision CPK's book equity was expected to be around $226 million at the end of the second quarter. With a share price in the low 20s, CPK's market capitalization stood at $644 million. The company had recently issued a 50% stock dividend, which had effectively split CPK shares on a 3-for-2 shares basis. CPK investors received one additional share for every two shares of common stock held. Adjusted for the stock dividend, Exhibit 32.6 shows the performance of CPK stock relative to that of industry peers. EXHIBIT 32.6 I Stock Price Comparison Value of $100 Invested in CPK and S&P SmallCap 600 Restaurants Index $140 $130 $120 $110 S&P SmallCap 600 Restaurants $100 $90 $80 4/3/2007 3/3/2007 5/3/2007 6/3/2007 Note: Adjusted for the June 2007 50% stock dividend. With such a dividend, an owner of two shares of CPK stock was given an additional share. The effect was to increase CPK shares by one-third, yet maintain the overall capitalization of the equity. Sources of data: Yahoo! Finance and Datastream. 7/3/2006 8/3/2006 9/3/2006 10/3/2006 11/3/2006 12/3/2006 1/3/2007 2/3/2007 Despite the challenges of growing the number of restaurants by 38% over the last five years, CPK consistently generated strong operating returns. CPK's return on equity (ROE), which was 10.1% for 2006, did not benefit from financial leverage..4 Financial policy varied across the industry, with some firms remaining all equity capitalized and others levering up to half debt financing. Exhibit 32.7 depicts selected financial data for peer firms. Because CPK used the proceeds from its 2000 initial public offering (IPO) to pay off its outstanding debt, the company completely avoided debt financing. CPK maintained borrowing capacity available under an existing $75 million line of credit. Interest on the line of credit was calculated at LIBOR plus 0.80%. With LIBOR currently at 5.36%, the line of credit's interest rate was 6.16% (see Exhibit 32.8). Fiscal Year End Month 7/2/2007 Share Price EBITDA Margin Net Profit Margin Earnings per Share Dividends per Share Book Value per Share Revenue Beta $ 0.00 Dec. Dec 0.20 Dec 0.85 0.80 1.05 0.90 1.10 1.00 June Dec California Pizza Kitchen Applebee's International, Inc. BJ's Restaurants, Inc. Brinker International Buffalo Wild Wings, Inc. The Cheesecake Factory, Inc. Chipotle Mexican Grill, Inc. Darden Restaurants, Inc. Frisch's Restaurants, Inc. McCormick & Schmick's Panera Bread Company P.F. Chang's China Bistro RARE Hospitality Int'l Inc. Red Robin Gourmet Burgers Ruth's Chris Steak House, Inc. Sonic Corporation Texas Roadhouse, Inc. Dec. Dec. May May NA $22.10 24.28 20.05 29.37 41.78 24.57 86.00 44.14 30.54 25.66 46.02 35.37 26.76 40.19 16.80 22.00 12.81 $55 1,338 239 4,151 278 1,315 823 5,721 291 308 829 938 987 10.7% 15.9% 9.6% 12.0% 13.3% 12.2% 13.0% 13.2% 31.6% 9.7% 16.3% 10.5% 11.6% 13.7% 15.6% 24.9% 12.5% 3.8% 6.5% 4.1% 4.7% 5.8% 6.2% 5.0% 5.9% 3.1% 4.3% 7.2% 3.6% 5.1% 4.9% 8.7% 11.4% 5.7% $0.71 1.17 0.41 1.49 0.93 1.02 1.28 2.16 1.78 0.92 1.87 1.24 1.45 1.82 1.01 0.00 0.20 0.00 0.00 0.00 0.40 0.44 0.00 0.00 $7.20 6.49 7.78 8.59 6.61 9.09 14.56 8.37 19.84 11.20 12.53 11.41 11.17 14.68 2.93 4.66 4.30 Dec 1.00 0.60 1.10 1.25 1.10 0.57 1.05 Dec Dec Dec. Dec Dec Aug. Dec 0.00 619 272 0.00 0.00 0.00 0.00 0.00 NA 0.88 693 597 0.90 0.90 0.44 Current Assets Total Debt Share Equity Debt Capital Interest Coverage Total Capital Turnover Current Liabilities $ 66 187 $ 38 $ 0 175 2.7 105 96 242 36 502 75 497 26 163 $ 208 487 203 1,076 116 712 474 1.230 101 203 179 61 California Pizza Kitchen Applebee's International, Inc. BJ's Restaurants, Inc. Brinker International Buffalo Wild Wings, Inc. The Cheesecake Factory, Inc. Chipotle Mexican Grill, Inc. Darden Restaurants, Inc. Frisch's Restaurants, Inc. McCormick & Schmick's Panera Bread Company P.F. Chang's China Bistro RARE Hospitality Int'l Inc. Red Robin Gourmet Burgers Ruth's Chris Steak House, Inc. Sonic Corporation Texas Roadhouse, Inc. 378 645 Return on Capital Equity 10.1% 10.1% 14.0% 18.0% 4.9% 4.9% 13.2% 18.0% 14.0% 14.0% 11.4% 11.4% 8.8% 8.7% 20.6% 27.5% 7.9% 9.1% 8.3% 8.3% 15.1% 15.1% 11.1% 11.5% 9.8% 13.9% 9.3% 12.5% 18.6% 34.9% 15.3% 20.1% 9.7% 10.7% 12 0.0% 26.5% 0.0% 31.8% 0.0% 0.0% 0.0% 34.4% 30.1% 0.2% 0.0% 6.2% 31.6% 31.9% 50.0% 28.9% 10.2% 1,026 31 40 110 NMF 11.7 NME 14.4 NME NME NMF 10.9 5.9 NMF NME NMF 29.2 7.7 12.8 15.0 19.9 30 160 128 166 114 398 290 360 244 68 68 159 36 392 319 2000 30-year 5.94% 5.49% 2001 Average LIBOR 3-month 6.55% 3.63% 1.79% 1.22% 1.67% 3.63% 3-month 5.85% 3.45% 1.62% 1.02% 1.38% 3.16% 2002 2003 2004 2005 2006: Jan. Feb. Mar. Apr. May. June July Aug. Sept. Oct. Nov. Dec. 2007: Jan 4.20% 4.41% 4.51% 4.59% 4.72% 4.79% 4.96% 4.98% 4.82% 4.89% 4.95% 4.85% U.S. Treasury Securities Notes & Bonds 6-month 3-year 10-year 5.92% 6.22% 6.03% 3.39% 4.09% 5.02% 1.69% 3.10% 4.61% 1.06% 2.10% 4.01% 1.58% 2.78% 4.27% 3.40% 3.93% 4.29% 4.30% 4.35% 4.42% 4.51% 4.64% 4.57% 4.61% 4.74% 4.72% 4.72% 4.89% 4.99% 4.81% 4.97% 5.11% 4.95% 5.09% 5.11% 5.09% 5.07% 5.09% 4.99% 4.85% 4.88% 4.90% 4.69% 4.72% 4.91% 4.72% 4.73% 4.96% 4.64% 4.60% 4.88% 4.58% 4.56% 4.94% 4.79% 4.76% 4.97% 4.75% 4.72% 4.90% 4.51% 4.56% 4.87% 4.60% 4.69% 4.80% 4.69% 4.75% 4.77% 5.00% 5.10% 4.54% 4.73% 5.06% 5.20% 5.15% 5.13% 5.00% 4.85% 4.85% 4.69% 4.68% 4.85% 4.82% 4.72% 4.87% 4.90% 5.20% Corporate bonds (Moody's) Aaa 3 Baa 7.62% 8.36% 7.08% 7.95% 6.49% 7.80% 5.67% 6.77% 5.63% 6.39% 5.24% 6.06% 5.29% 6.24% 5.35% 6.27% 5.53% 6.41% 5.84% 6.68% 5.95% 6.75% 5.89% 6.78% 5.85% 6.76% 5.68% 6.59% 5.51% 6.43% 5.51% 6.42% 5.33% 6.20% 5.32% 6.22% 5.40% 6.34% 5.39% 6.28% 5.30% 6.27% 5.47% 6.39% 5.47% 6.39% 5.79% 6.70% Average Prime Lending 9.23% 6.91% 4.67% 4.12% 4.34% 6.19% 7.38% 7.50% 7.63% 7.75% 7.88% 7.13% 8.25% 8.25% 8.25% 8.25% 8.25% 8.25% 8.25% 8.25% 8.25% 8.25% 8.25% 8.25% 4.68% 4.82% 4.99% 5.15% 5.23% 5.51% 5.49% 5.40% 5.37% 5.37% 5.37% 5.36% 5.36% 5.36% 5.35% 5.36% 5.36% 5.36% Feb. Mar. Apr. 4.96% 5.02% 4.97% 4.88% 4.77% 4.63% May. June The recent 10% share price decline seemed to raise the question of whether this was an ideal time to repurchase shares and potentially leverage the company's balance sheet with ample borrowings available on its existing line of credit. One gain from the leverage would be to reduce the corporate income tax liability, which had been almost $10 million in 2006. Exhibit 32.9 provides pro forma financial summaries of CPK's tax shield under alternative capital structures. Still, CPK needed to preserve its ability to fund the strong expansion outlined for the company. Any use of financing to return capital to shareholders needed to be balanced with management's goal of growing the business. Debt/Total Capital 20% Actual 10% 30% 6.16% 32.5% 6.16% 32.5% 30,054 Interest rate (1) Tax rate Earnings before income taxes and Interest Interest expense Earnings before taxes Income taxes Net Income Book value: Debt Equity Total capital Market value: Debt 6.16% 32.5% 30.054 1.391 28,663 9,303 19.359 6.16% 32.5% 30,054 4.174 25,880 8.400 17.480 30,054 2,783 27,271 8.852 18,419 30,054 9.755 20,299 225,888 225.888 22,589 203,299 225,888 45,178 180,710 225,888 67.766 158,122 225.888 Equity 22,589 628,516 651,105 643.773 643.773 45,178 613,259 658,437 67.766 598,002 665,769 Market value of capital EXHIBIT 32.9 1 Pro Forma Tax Shield Effect of Recapitalization Scenarios (dollars in thousands, except share data; figures based on end of June 2007) Notes: (1
Step by Step Solution
There are 3 Steps involved in it

Get step-by-step solutions from verified subject matter experts