

Question: Using the Screenshots below, please calculate the two formulas in yellow with workings Statement of Profit or Loss for the year ended 27 June 2021
Using the Screenshots below, please calculate the two formulas in yellow with workings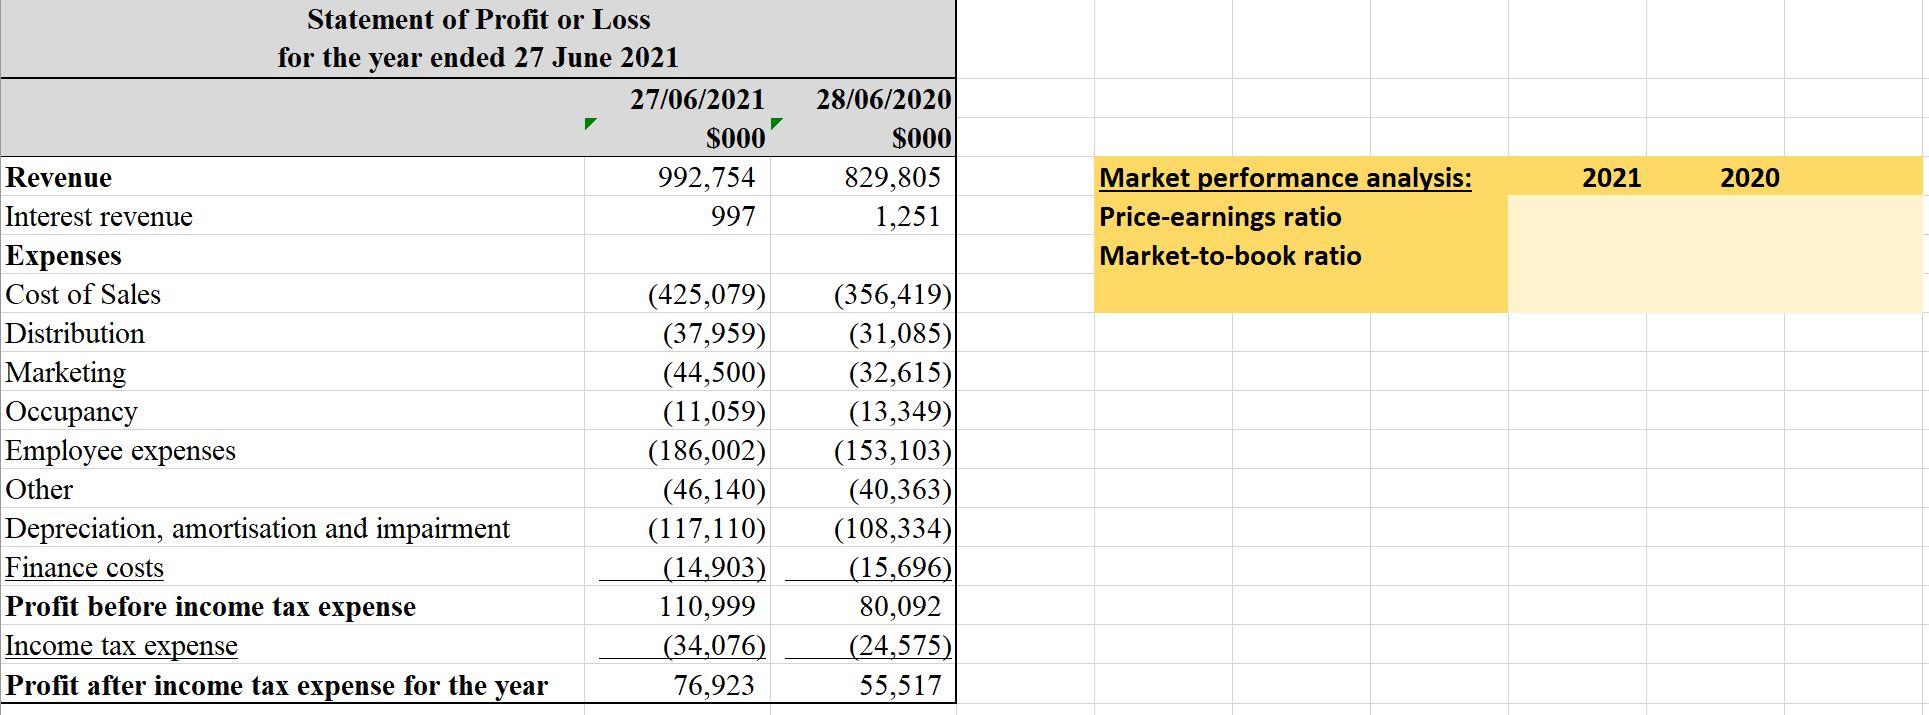
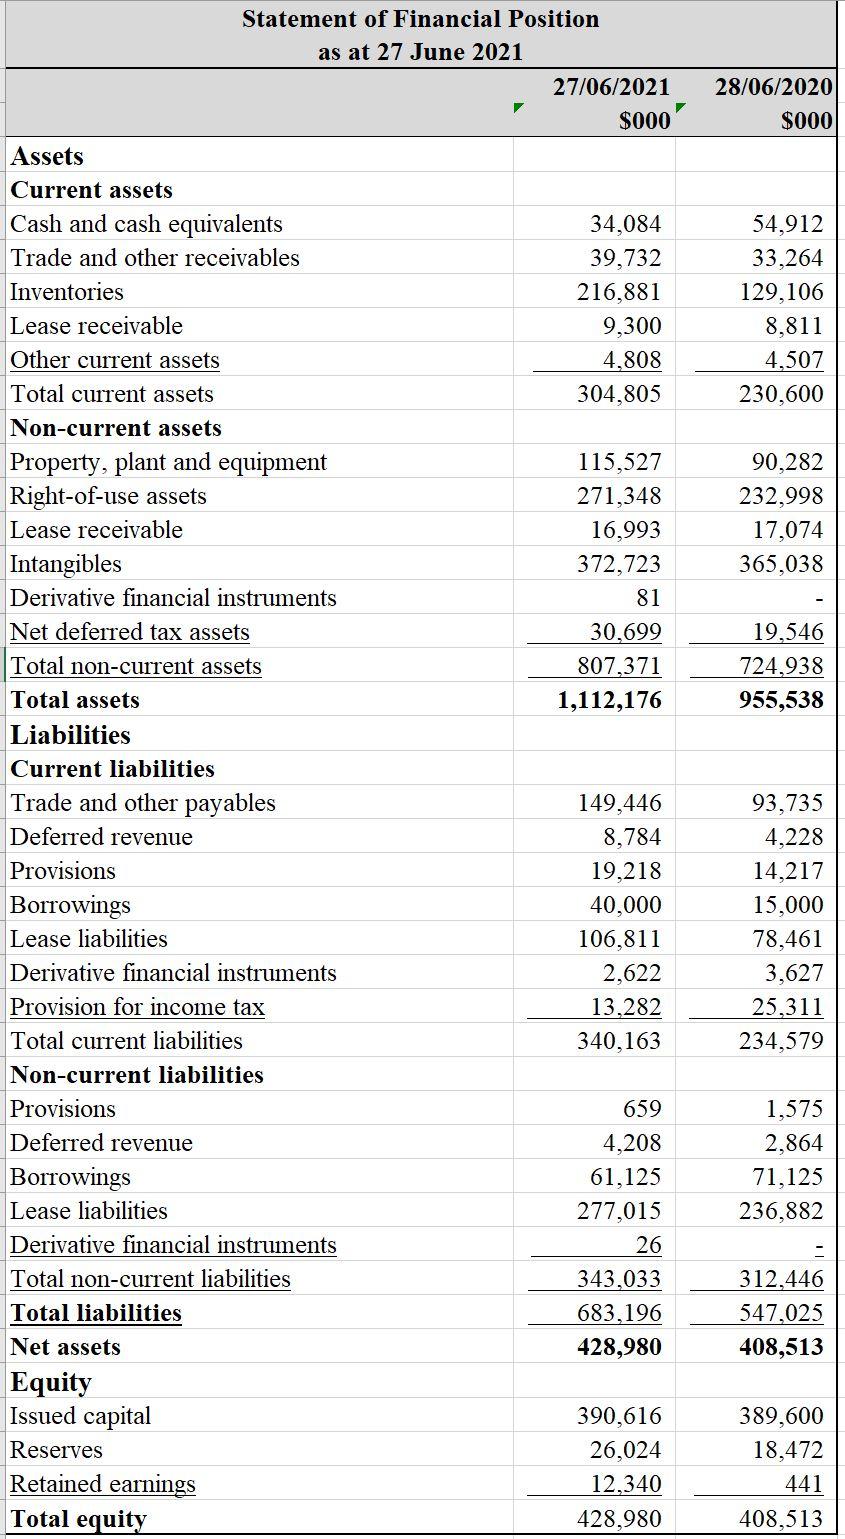
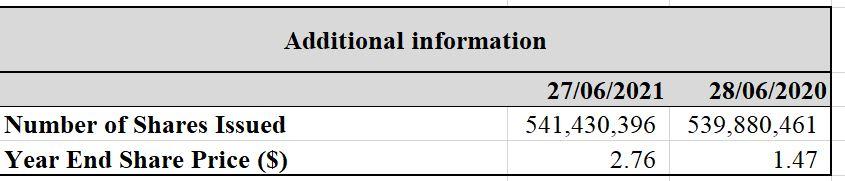
Statement of Profit or Loss for the year ended 27 June 2021 Revenue Interest revenue Expenses Cost of Sales Distribution Marketing Occupancy Employee expenses Other Depreciation, amortisation and impairment Finance costs Profit before income tax expense Income tax expense Profit after income tax expense for the year 27/06/2021 $000 992,754 997 (425,079) (37,959) (44,500) (11,059) (186,002) (46,140) (117,110) (14,903) 110,999 (34,076) 76,923 28/06/2020 $000 829,805 1,251 (356,419) (31,085) (32,615) (13,349) (153,103) (40,363) (108,334) (15,696) 80,092 (24,575) 55,517 Market performance analysis: Price-earnings ratio Market-to-book ratio 2021 2020 Statement of Financial Position as at 27 June 2021 Assets Current assets Cash and cash equivalents Trade and other receivables Inventories Lease receivable Other current assets Total current assets Non-current assets Property, plant and equipment Right-of-use assets Lease receivable Intangibles Derivative financial instruments Net deferred tax assets Total non-current assets Total assets Liabilities Current liabilities Trade and other payables Deferred revenue Provisions Borrowings Lease liabilities Derivative financial instruments Provision for income tax Total current liabilities Non-current liabilities Provisions Deferred revenue Borrowings Lease liabilities Derivative financial instruments Total non-current liabilities Total liabilities Net assets Equity Issued capital Reserves Retained earnings Total equity 27/06/2021 $000 34,084 39,732 216,881 9,300 4,808 304,805 ,527 271,348 16,993 372,723 81 30,699 807,371 1,112,176 149,446 8,784 19,218 40,000 106,811 2,622 13,282 340,163 659 4,208 61,125 277,015 26 343,033 683,196 428,980 390,616 26,024 12,340 428,980 7 28/06/2020 $000 54,912 33,264 129,106 8,811 4,507 230,600 90,282 232,998 17,074 365,038 19,546 724,938 955,538 93,735 4,228 14,217 15,000 78,461 3,627 25,311 234,579 1,575 2,864 71,125 236,882 312,446 547,025 408,513 389,600 18,472 441 408,513 Additional information Number of Shares Issued Year End Share Price ($) 27/06/2021 28/06/2020 541,430,396 539,880,461 2.76 1.47
Step by Step Solution
There are 3 Steps involved in it

Get step-by-step solutions from verified subject matter experts