

Question: Using the SEVENTHGRADE data from the textbook, graph the distribution of the IQ scores for the grade seven students (with a histogram). (a) Describe the

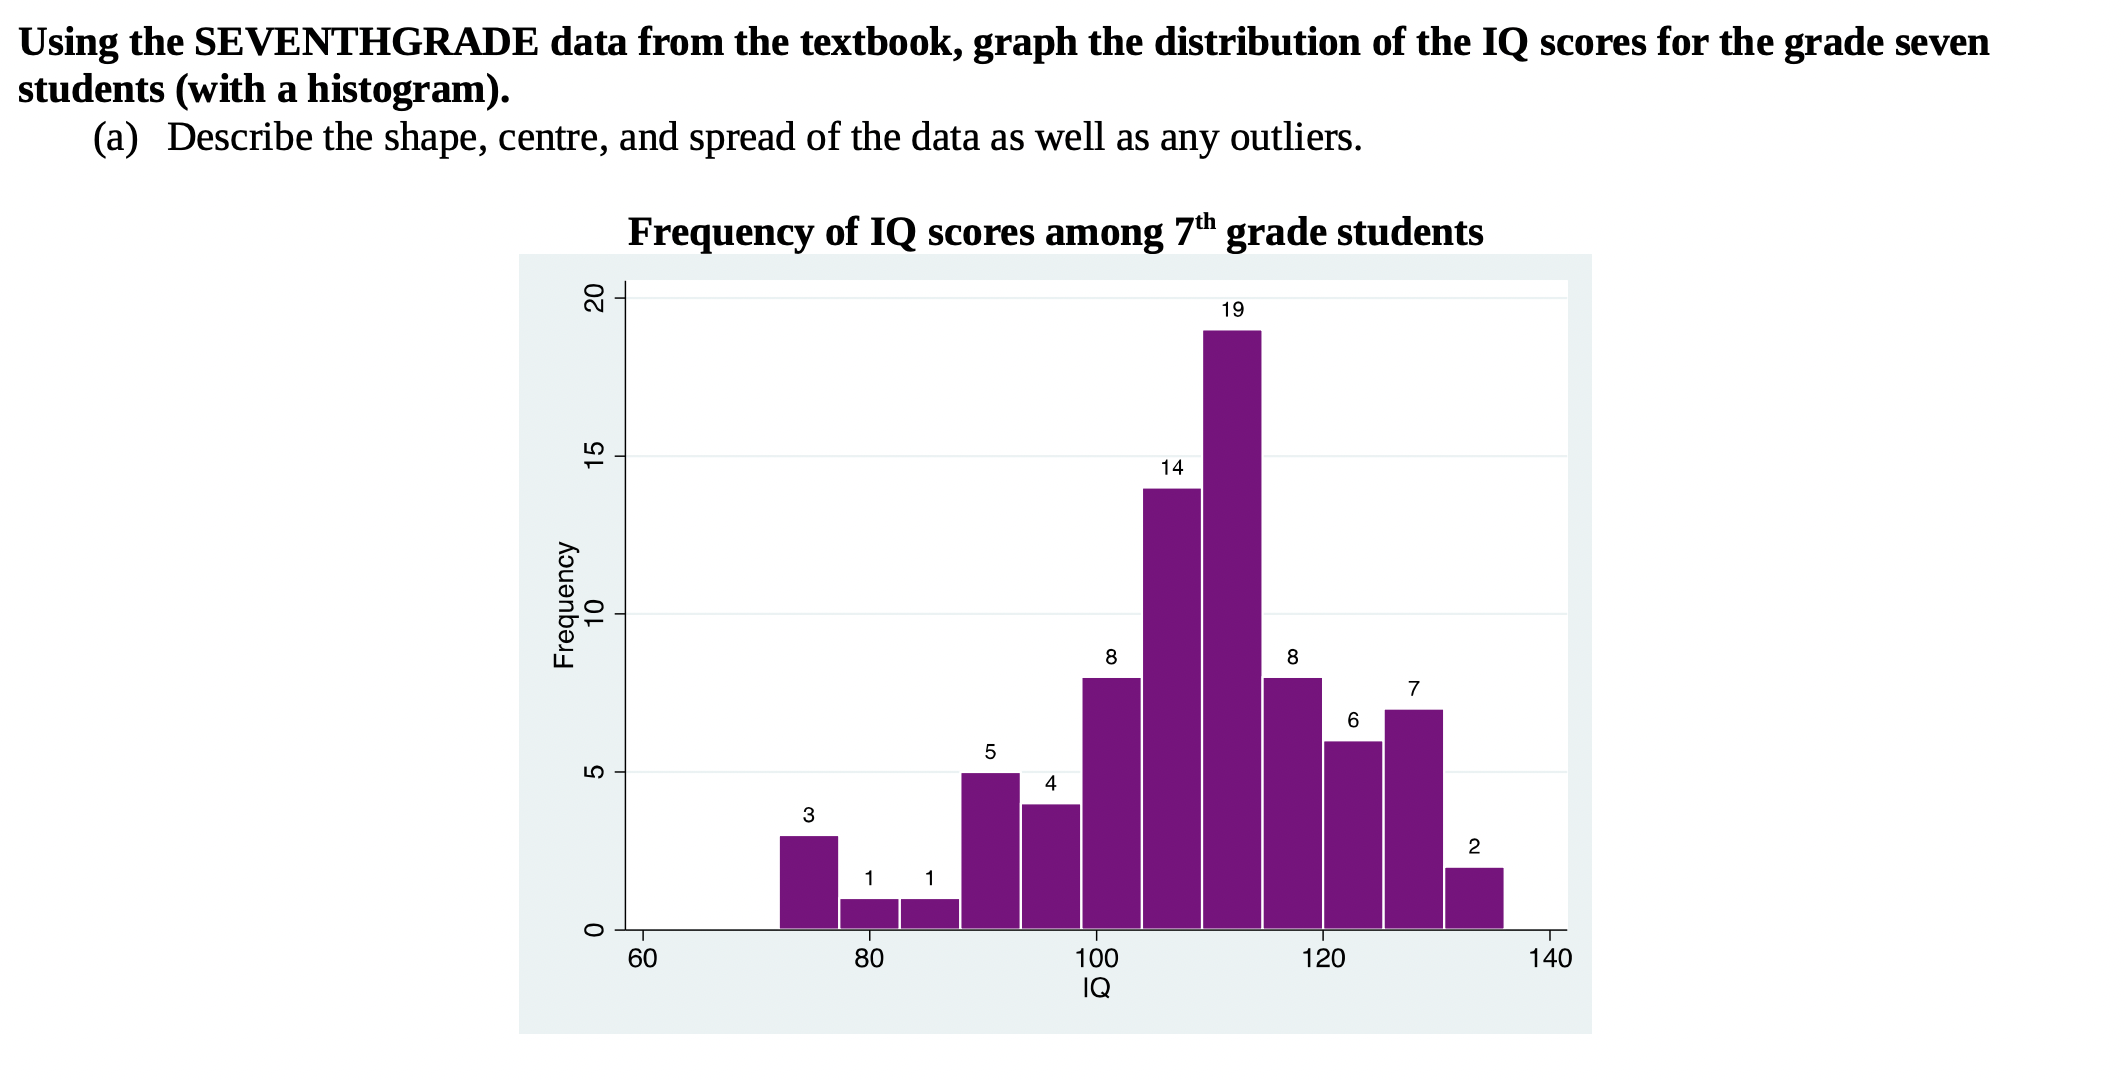
Using the SEVENTHGRADE data from the textbook, graph the distribution of the IQ scores for the grade seven students (with a histogram). (a) Describe the shape, centre, and spread of the data as well as any outliers. Frequency of IQ scores among 7'\" grade students 19 15 | Frequency 1 0 60 80 100 120 140
Step by Step Solution
There are 3 Steps involved in it
1 Expert Approved Answer
Step: 1 Unlock

Question Has Been Solved by an Expert!
Get step-by-step solutions from verified subject matter experts
Step: 2 Unlock
Step: 3 Unlock