

Question: Using the skills you have gained throughout this text, use Microsoft Power BI to complete the generic tasks presented below: Build a dashboard Power BI
Using the skills you have gained throughout this text, use Microsoft Power BI to complete the generic tasks presented below:
Build a dashboard Power BI called Management with the following: POWER BI ONLY
Add a filter to show only sales orders from November.
Add a table to your page called Total Sales by Day that shows the total sales order amount by sales order date. Power BI Hint: Use the date hierarchy to drill down to specific days of the month. Tableau Hint: Set the sales order date to DAY and place the total sales order amount as a text mark.
Add a bar chart to your page called Sales by Customer that shows the total sales order amount by customer account name in descending order.
Add a new matrix table to your page called AR by Customer that shows the customer and invoices in rows, and earliest invoice due date, age, and balance as values.
Create a parameter showing the Report Date as Power BI Hint: Create a new column and use the DATE function.
Create a new measure showing the Age as the difference between the Invoice Due Date and the Report Date. Power BI Hint: Use the DATEDIFF function to calculate the age and the MIN function on the date fields to load specific dates.
Use the AR Balance you created in Part
Filter the table to show only outstanding balances that are greater than
Add a new card to your page called Days Sales Outstanding to show the current KPI value. Hint: Create a new measure showing the DSO as the accounts receivable balance divided by the total sales amount multiplied by days.
In Tableau, combine all of these visuals into one dashboard.
Take a screenshot of your dashboard label it B
Save your workbook, answer the lab questions, th
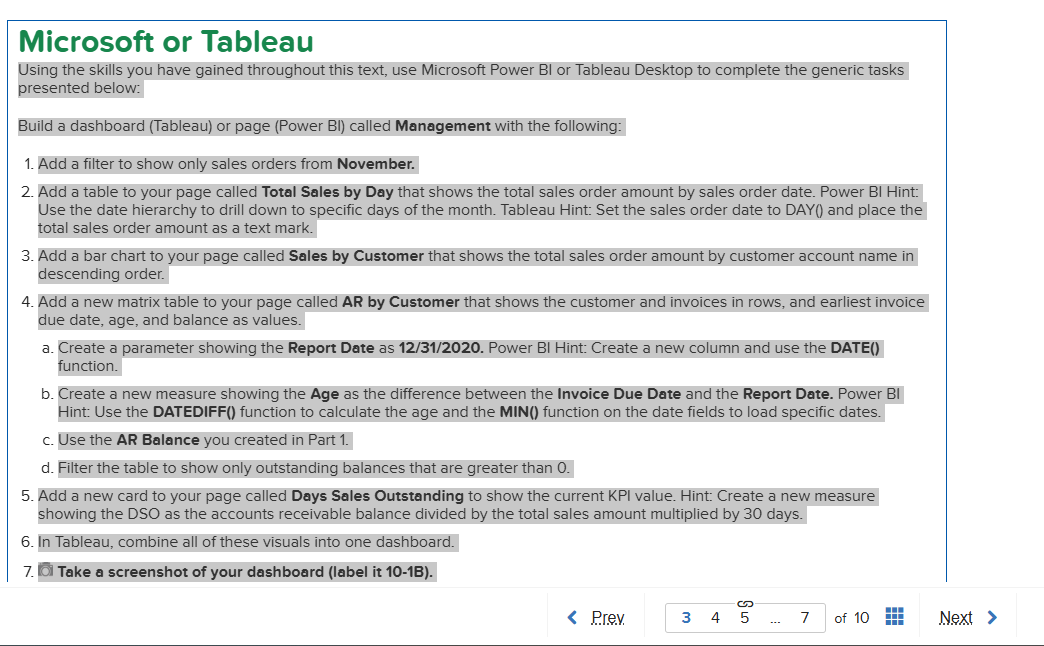
Microsoft or Tableau
Using the skills you have gained throughout this text, use Microsoft Power BI or Tableau Desktop to complete the generic tasks
presented below:
Build a dashboard Tableau or page Power BI called Management with the following:
Add a filter to show only sales orders from November.
Add a table to your page called Total Sales by Day that shows the total sales order amount by sales order date. Power BI Hint:
Use the date hierarchy to drill down to specific days of the month. Tableau Hint: Set the sales order date to DAY and place the
total sales order amount as a text mark.
Add a bar chart to your page called Sales by Customer that shows the total sales order amount by customer account name in
descending order.
Add a new matrix table to your page called AR by Customer that shows the customer and invoices in rows, and earliest invoice
due date, age, and balance as values.
a Create a parameter showing the Report Date as Power BI Hint: Create a new column and use the DATE
function.
b Create a new measure showing the Age as the difference between the Invoice Due Date and the Report Date. Power BI
Hint: Use the DATEDIFF function to calculate the age and the MIN function on the date fields to load specific dates.
c Use the AR Balance you created in Part
d Filter the table to show only outstanding balances that are greater than
Add a new card to your page called Days Sales Outstanding to show the current KPI value. Hint: Create a new measure
showing the DSO as the accounts receivable balance divided by the total sales amount multiplied by days.
In Tableau, combine all of these visuals into one dashboard.
Take a screenshot of your dashboard label it B
Step by Step Solution
There are 3 Steps involved in it
1 Expert Approved Answer
Step: 1 Unlock

Question Has Been Solved by an Expert!
Get step-by-step solutions from verified subject matter experts
Step: 2 Unlock
Step: 3 Unlock