

Question: Using the spreadsheet template provided, calculate the value of Generic Research under the growth strategy. In addition to the growth rate: They will spend an
Using the spreadsheet template provided, calculate the value of Generic Research under the growth strategy.
In addition to the growth rate:
They will spend an extra $5M on advertising in 2013, 2014 and 2015.The planning period growth rate is 8%, the terminal growth rate is 3%, and WACC is 8.8%.
The interest rate on new debt is 6.5%.
Revenues and expenses grow at the same rate.
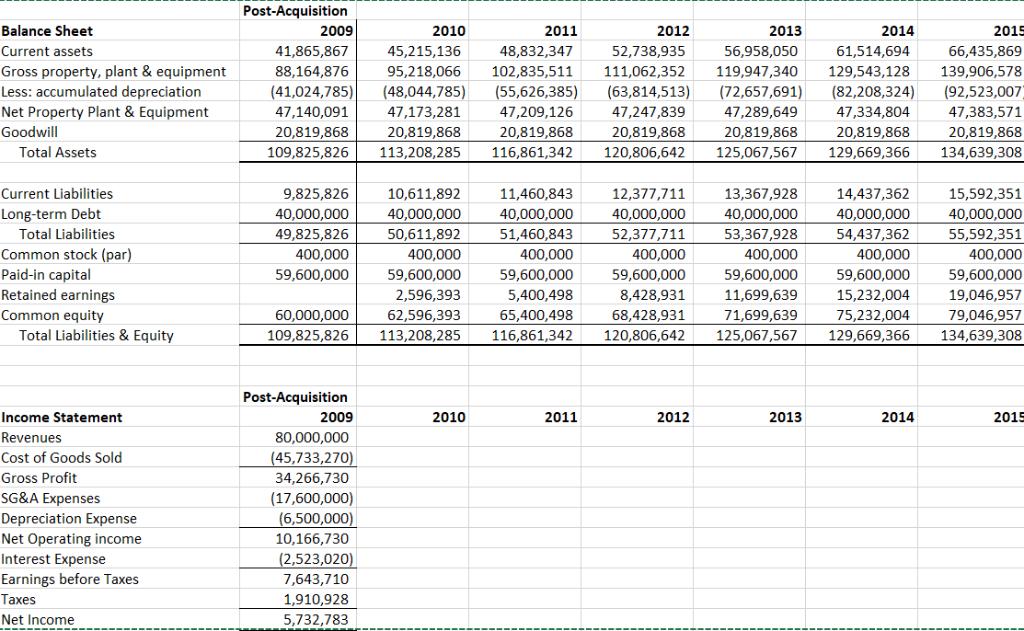
Use the following template. This contains the pro forma balance sheet, which has already been completed for you, and the post-acquisition 2009 numbers for the income statement. The groundwork has been laid, and you can start putting in your growth rates, calculating the pro forma income statement and the free cash flows. You can use a planning period of five years and use the sixth year for the terminal value calculation. Calculate terminal value using the growing perpetuity method.
Post-Acquisition Balance Sheet 2009 2010 2011 2012 2013 2014 2015 Current assets 41,865,867 45,215,136 48,832,347 52,738,935 56,958,050 61,514,694 66,435,869 Gross property, plant & equipment Less: accumulated depreciation Net Property Plant & Equipment 95,218,066 102,835,511 (55,626,385) 88,164,876 111,062,352 119,947,340 129,543,128 139,906,578 (92,523,007) (41,024,785) 47,140,091 (48,044,785) (63,814,513) (72,657,691) (82,208,324) 47,173,281 47,209,126 47,247,839 47,289,649 47,334,804 47,383,571 20,819,868 134,639,308 Goodwill 20,819,868 20,819,868 20,819,868 20,819,868 20,819,868 20,819,868 Total Assets 109,825,826 113,208,285 116,861,342 120,806,642 125,067,567 129,669,366 Current Liabilities 9,825,826 10,611,892 11,460,843 12,377,711 13,367,928 14,437,362 15,592,351 Long-term Debt 40,000,000 40,000,000 40,000,000 40,000,000 40,000,000 40,000,000 40,000,000 Total Liabilities 49,825,826 50,611,892 51,460,843 52,377,711 53,367,928 54,437,362 55,592,351 Common stock (par) Paid-in capital Retained earnings 400,000 400,000 400,000 400,000 400,000 400,000 400,000 59,600,000 59,600,000 59,600,000 59,600,000 59,600,000 59,600,000 59,600,000 2,596,393 5,400,498 8,428,931 11,699,639 15,232,004 19,046,957 Common equity Total Liabilities & Equity 60,000,000 62,596,393 65,400,498 68,428,931 71,699,639 75,232,004 79,046,957 109,825,826 113,208,285 116,861,342 120,806,642 125,067,567 129,669,366 134,639,308 Post-Acquisition Income Statement 2009 2010 2011 2012 2013 2014 2015 80,000,000 (45,733,270) Revenues Cost of Goods Sold Gross Profit 34,266,730 SG&A Expenses Depreciation Expense Net Operating income Interest Expense Earnings before Taxes (17,600,000) (6,500,000) 10,166,730 (2,523,020) 7,643,710 Taxes 1,910,928 Net Income 5,732,783
Step by Step Solution
There are 3 Steps involved in it
balance sheet postacquisition 2009 2010 2011 2012 2013 2014 2015 current assets 41865867 45215136 48832347 52738935 56958050 61514694 66435869 gross property plant equipment 88164876 95218066 10283551... View full answer

Get step-by-step solutions from verified subject matter experts
Document Format (1 attachment)
626243604d5c0_april22.xlsx
300 KBs Excel File