

Question: Using the stock data I provided (XOM, WYN, AAPL) change the provided bootstrap model to include a risk free option. Risk free implies there is
Using the stock data I provided (XOM, WYN, AAPL) change the provided bootstrap model to include a risk free option. Risk free implies there is no variance (or std dev) in the return. The current 3-month T-bill rate stands an equivalent annual rate of 1.6%. Redo our example from class, but include this risk free asset in your portfolio. Select 5 target returns (evenly spaced) (these will depend on what mean returns are even possible for your set of stocks, so I can't tell you values). For each target rate, record the optimal proportions and the standard deviation for each optimal portfolio. Using the above values, create the efficient frontier chart for your set of stocks (and risk-free rate).
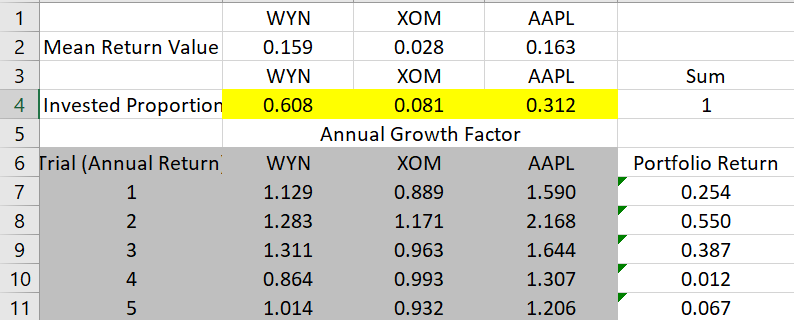
WYN 2 Mean Return Value 0.159 WYN 4 Invested Proportion 0.608 XOM 0.028 XOM 0.081 Annual Growth Factor AAPL 0.163 AAPL 0.312 Sum 1 6 Trial (Annual Return WYN 1.129 1.283 1.311 0.864 1.014 AAPL 1.590 2.168 1.644 1.307 1.206 Portfolio Return 0.254 0.550 0.387 0.012 0.067 0.889 0.963 0.993 0.932 10 4 5
Step by Step Solution
There are 3 Steps involved in it

Get step-by-step solutions from verified subject matter experts