

Question: Using the table above answer : Question 1 a) What is the Year 1 Market Value for the apartment building, based on Direct Capitalization, rounded
Using the table above answer :
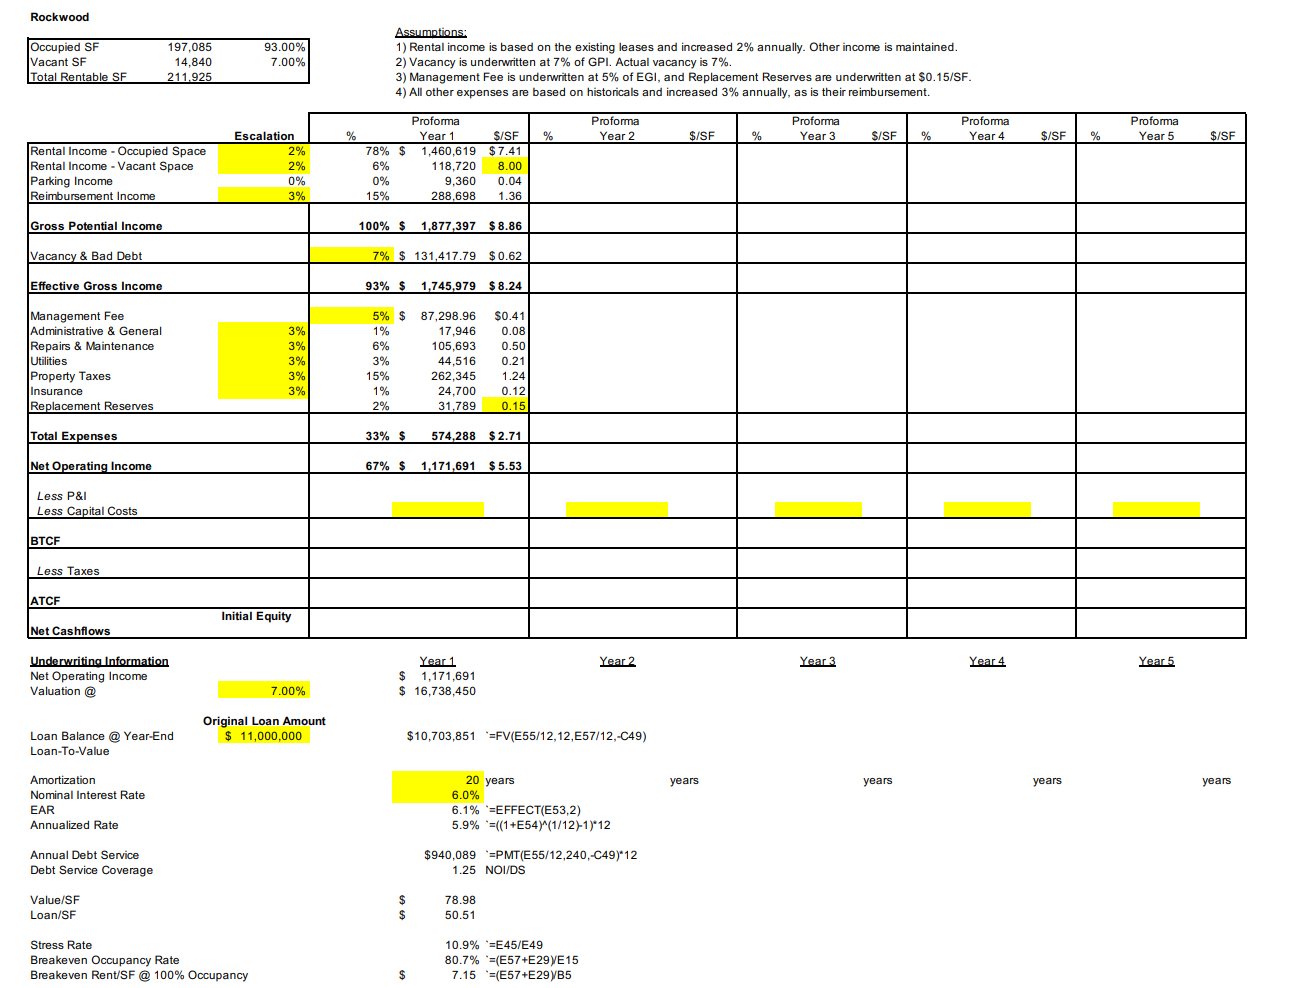
Question 1
a) What is the Year 1 Market Value for the apartment building, based on Direct Capitalization, rounded to the nearest $1,000 ($X,XXX)? e.g. a value of 4,365,795 would be rounded to $4,366,000
b) What is the Year 1 Breakeven Monthly Rent/Unit at 100% occupancy for the apartment building, assuming all operating expenses are fixed ($X,XXX)? Round to the nearest dollar.
c) What is the debt service coverage in year 1 for the apartment (X.XX)?
Rockwood Occupied SF Vacant SF Total Rentable SF 197,085 14,840 211.925 93.00% 7.00% Assumptions: 1) Rental income is based on the existing leases and increased 2% annually. Other income is maintained. 2) Vacancy is underwritten at 7% of GPI. Actual vacancy is 7%. 3) Management Fee is underwritten at 5% of EGI, and Replacement Reserves are underwritten at $0.15/SF. 4) All other expenses are based on historicals and increased 3% annually, as is their reimbursement. Proforma Proforma Proforma Proforma Year 1 S/SE % Year 2 $/SF % Year 3 S/SF % Year 4 78% $ 1,460,619 $7.41 6% 118,720 8.00 0% 9,360 0.04 15% 288,698 1.36 Proforma Year 5 % $/SF % $/SF Rental Income - Occupied Space Rental Income - Vacant Space Parking Income Reimbursement Income Escalation 2% 2% 0% 3% Gross Potential Income 100% $ 1,877,397 $8.86 Vacancy & Bad Debt 7% $ 131,417.79 $ 0.62 Effective Gross Income 93% $ 1,745,979 1,745,979 $ 8.24 Management Fee Administrative & General Repairs & Maintenance Utilities Property Taxes Insurance Replacement Reserves 3% 3% 3% 3% 3% 5% $ 1% 6% 3% 15% 1% 2% 87,298.96 17,946 105,693 44,516 262,345 24,700 31,789 $0.41 0.08 0.50 0.21 1.24 0.12 0.15 Total Expenses 33% $ 574,288 $2.71 Net Operating Income 67% $ 1,171,691 $5.53 Less P&I Less Capital Costs BTCF Less Taxes ATCF Initial Equity Net Cashflows Year 2 Year 3 Year 4 Year 5 Underwriting Information Net Operating Income Valuation @ Year 1 $ 1,171,691 $ 16,738,450 7.00% Original Loan Amount $ 11,000,000 Loan Balance @ Year-End Loan-To-Value $10,703,851 '=FV(E55/12,12, E57/12,-C49) 20 years years years years years Amortization Nominal Interest Rate EAR Annualized Rate 6.0% 6.1% '=EFFECT(E53,2) 5.9% '=((1+E54)(1/12)-1) 12 Annual Debt Service Debt Service Coverage $940,089 "=PMT(E55/12,240,-C49)*12 1.25 NOI/DS Value/SF Loan/SF $ $ 78.98 50.51 Stress Rate Breakeven Occupancy Rate Breakeven Rent/SF @ 100% Occupancy 10.9% '=E45/E49 80.7% '=(E57+E297E15 7.15 '=(E57+E29YB5 $ Rockwood Occupied SF Vacant SF Total Rentable SF 197,085 14,840 211.925 93.00% 7.00% Assumptions: 1) Rental income is based on the existing leases and increased 2% annually. Other income is maintained. 2) Vacancy is underwritten at 7% of GPI. Actual vacancy is 7%. 3) Management Fee is underwritten at 5% of EGI, and Replacement Reserves are underwritten at $0.15/SF. 4) All other expenses are based on historicals and increased 3% annually, as is their reimbursement. Proforma Proforma Proforma Proforma Year 1 S/SE % Year 2 $/SF % Year 3 S/SF % Year 4 78% $ 1,460,619 $7.41 6% 118,720 8.00 0% 9,360 0.04 15% 288,698 1.36 Proforma Year 5 % $/SF % $/SF Rental Income - Occupied Space Rental Income - Vacant Space Parking Income Reimbursement Income Escalation 2% 2% 0% 3% Gross Potential Income 100% $ 1,877,397 $8.86 Vacancy & Bad Debt 7% $ 131,417.79 $ 0.62 Effective Gross Income 93% $ 1,745,979 1,745,979 $ 8.24 Management Fee Administrative & General Repairs & Maintenance Utilities Property Taxes Insurance Replacement Reserves 3% 3% 3% 3% 3% 5% $ 1% 6% 3% 15% 1% 2% 87,298.96 17,946 105,693 44,516 262,345 24,700 31,789 $0.41 0.08 0.50 0.21 1.24 0.12 0.15 Total Expenses 33% $ 574,288 $2.71 Net Operating Income 67% $ 1,171,691 $5.53 Less P&I Less Capital Costs BTCF Less Taxes ATCF Initial Equity Net Cashflows Year 2 Year 3 Year 4 Year 5 Underwriting Information Net Operating Income Valuation @ Year 1 $ 1,171,691 $ 16,738,450 7.00% Original Loan Amount $ 11,000,000 Loan Balance @ Year-End Loan-To-Value $10,703,851 '=FV(E55/12,12, E57/12,-C49) 20 years years years years years Amortization Nominal Interest Rate EAR Annualized Rate 6.0% 6.1% '=EFFECT(E53,2) 5.9% '=((1+E54)(1/12)-1) 12 Annual Debt Service Debt Service Coverage $940,089 "=PMT(E55/12,240,-C49)*12 1.25 NOI/DS Value/SF Loan/SF $ $ 78.98 50.51 Stress Rate Breakeven Occupancy Rate Breakeven Rent/SF @ 100% Occupancy 10.9% '=E45/E49 80.7% '=(E57+E297E15 7.15 '=(E57+E29YB5 $
Step by Step Solution
There are 3 Steps involved in it

Get step-by-step solutions from verified subject matter experts