

Question: Using the table above, determine the empirical probability that an individual in the 20-24 age group has chlamydia.Using the table above, determine the empirical probability
Using the table above, determine the empirical probability that an individual in the 20-24 age group has chlamydia.Using the table above, determine the empirical probability that an individual in the 20-24 age group does not havechlamydia. Enter your answer as a percent to two decimal places.
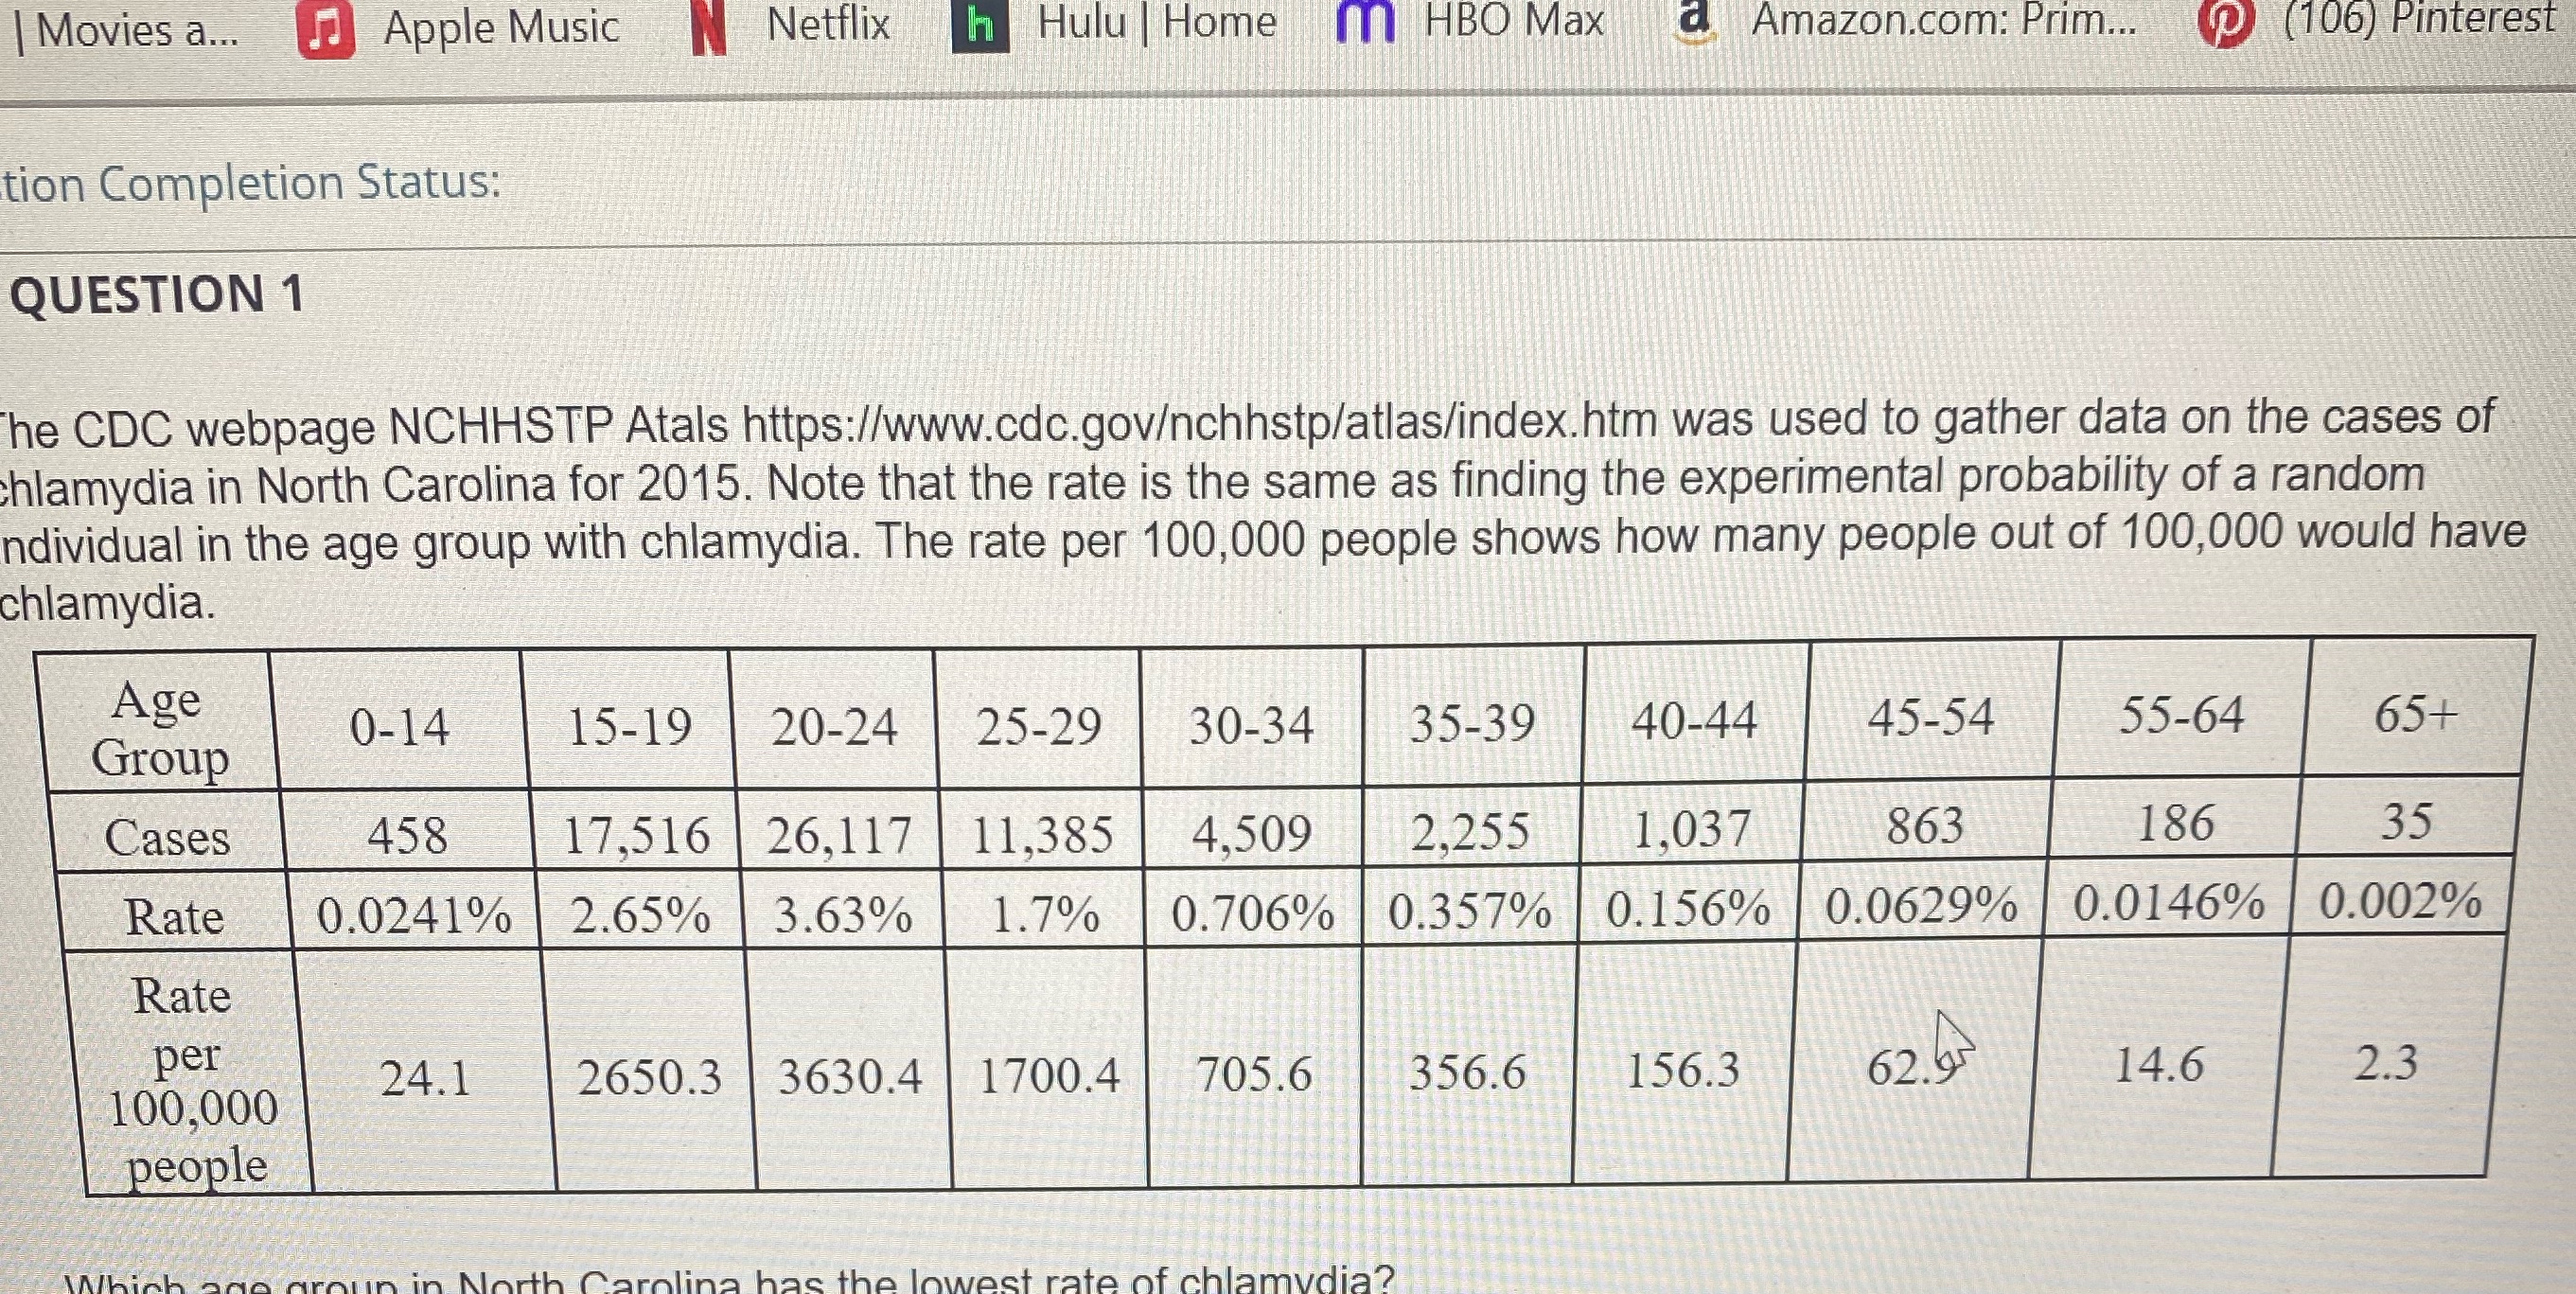
Movies a... Apple Music Netflix h Hulu | Home m HBO Max Amazon.com: Prim... (p (106) Pinterest tion Completion Status: QUESTION 1 The CDC webpage NCHHSTP Atals https://www.cdc.govchhstp/atlas/index.htm was used to gather data on the cases of chlamydia in North Carolina for 2015. Note that the rate is the same as finding the experimental probability of a random ndividual in the age group with chlamydia. The rate per 100,000 people shows how many people out of 100,000 would have chlamydia. Age 0-14 Group 15-19 20-24 25-29 30-34 35-39 40-44 45-54 55-64 65+ Cases 458 17,516 26,117 11,385 4,509 2,255 1,037 863 186 35 Rate 0.0241% 2.65% 3.63% 1.7% 0.706% 0.357% 0.156% 0.0629% | 0.0146% 0.002% Rate per 100,000 24.1 2650.3 3630.4 1700.4 705.6 356.6 156.3 62. br 14.6 2.3 people chlamydia
Step by Step Solution
There are 3 Steps involved in it

Get step-by-step solutions from verified subject matter experts