

Question: Using the table above, how the TRIN has changed from day 1 to day 4 and what sign does it show? Question Completion Status: 0
Using the table above, how the TRIN has changed from day 1 to day 4 and what sign does it show?
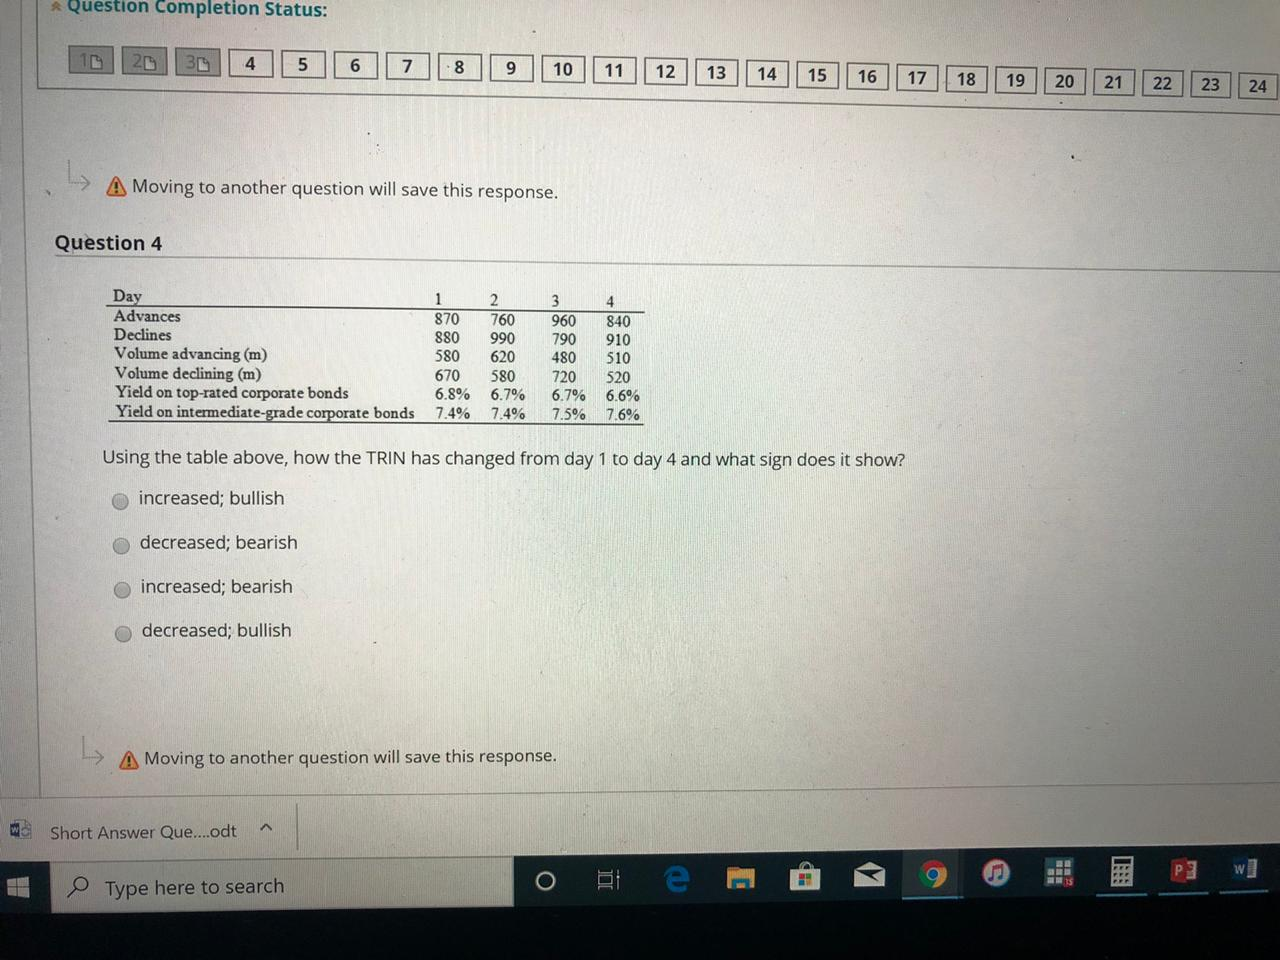
Question Completion Status: 0 20 30 4 5 6 7 8 9 10 11 12 13 14 15 16 17 18 19 20 21 22 23 24 > A Moving to another question will save this response. Question 4 3 960 790 4 840 910 Day Advances Declines Volume advancing (m) Volume declining (m) Yield on top-rated corporate bonds Yield on intermediate-grade corporate bonds 1 870 880 580 670 6.8% 7.4% 2 760 990 620 580 6.7% 7,4% 510 720 6.7% 7.5% 520 6.6% 7.6% Using the table above, how the TRIN has changed from day 1 to day 4 and what sign does it show? o increased; bullish decreased; bearish o increased; bearish decreased; bullish A Moving to another question will save this response. Short Answer Que....odt ^ o B e C @ 9 .1 P] W] Type here to search
Step by Step Solution
There are 3 Steps involved in it

Get step-by-step solutions from verified subject matter experts