

Question: Using the table below, calculate the APC and the APS Disposable Income Consumption $10.000 $8,400 Instructions: Round your answers to 2 decimal places APC: APSUsing
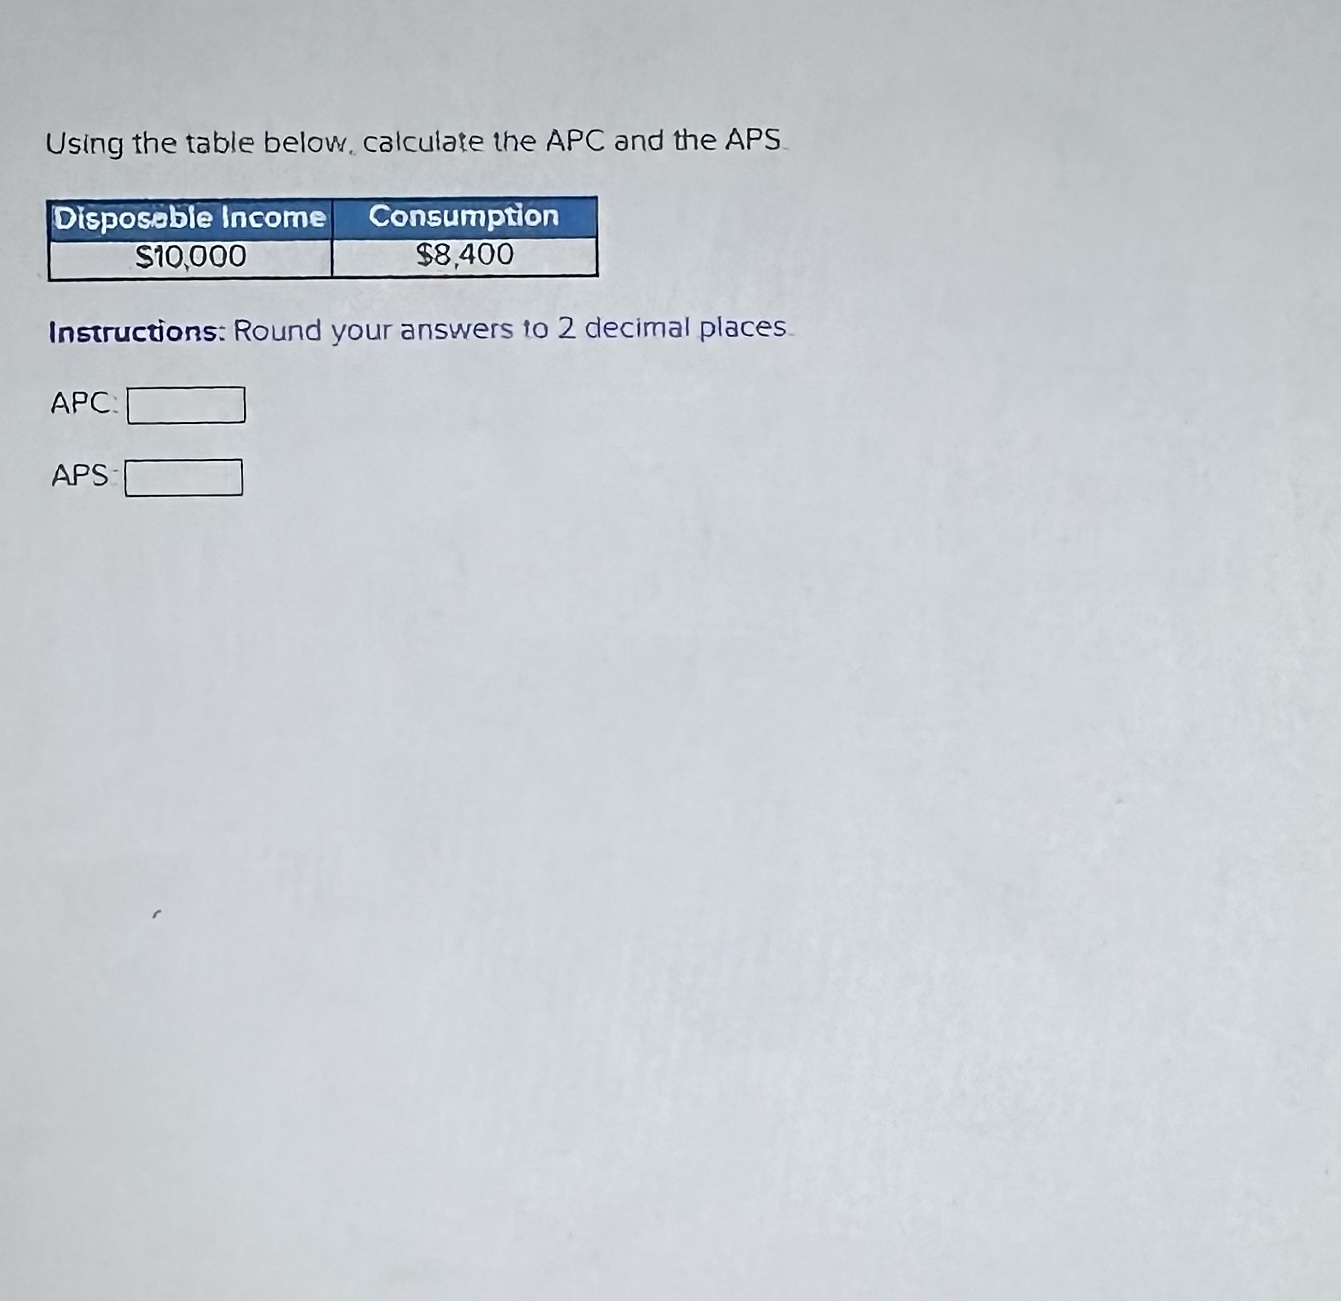
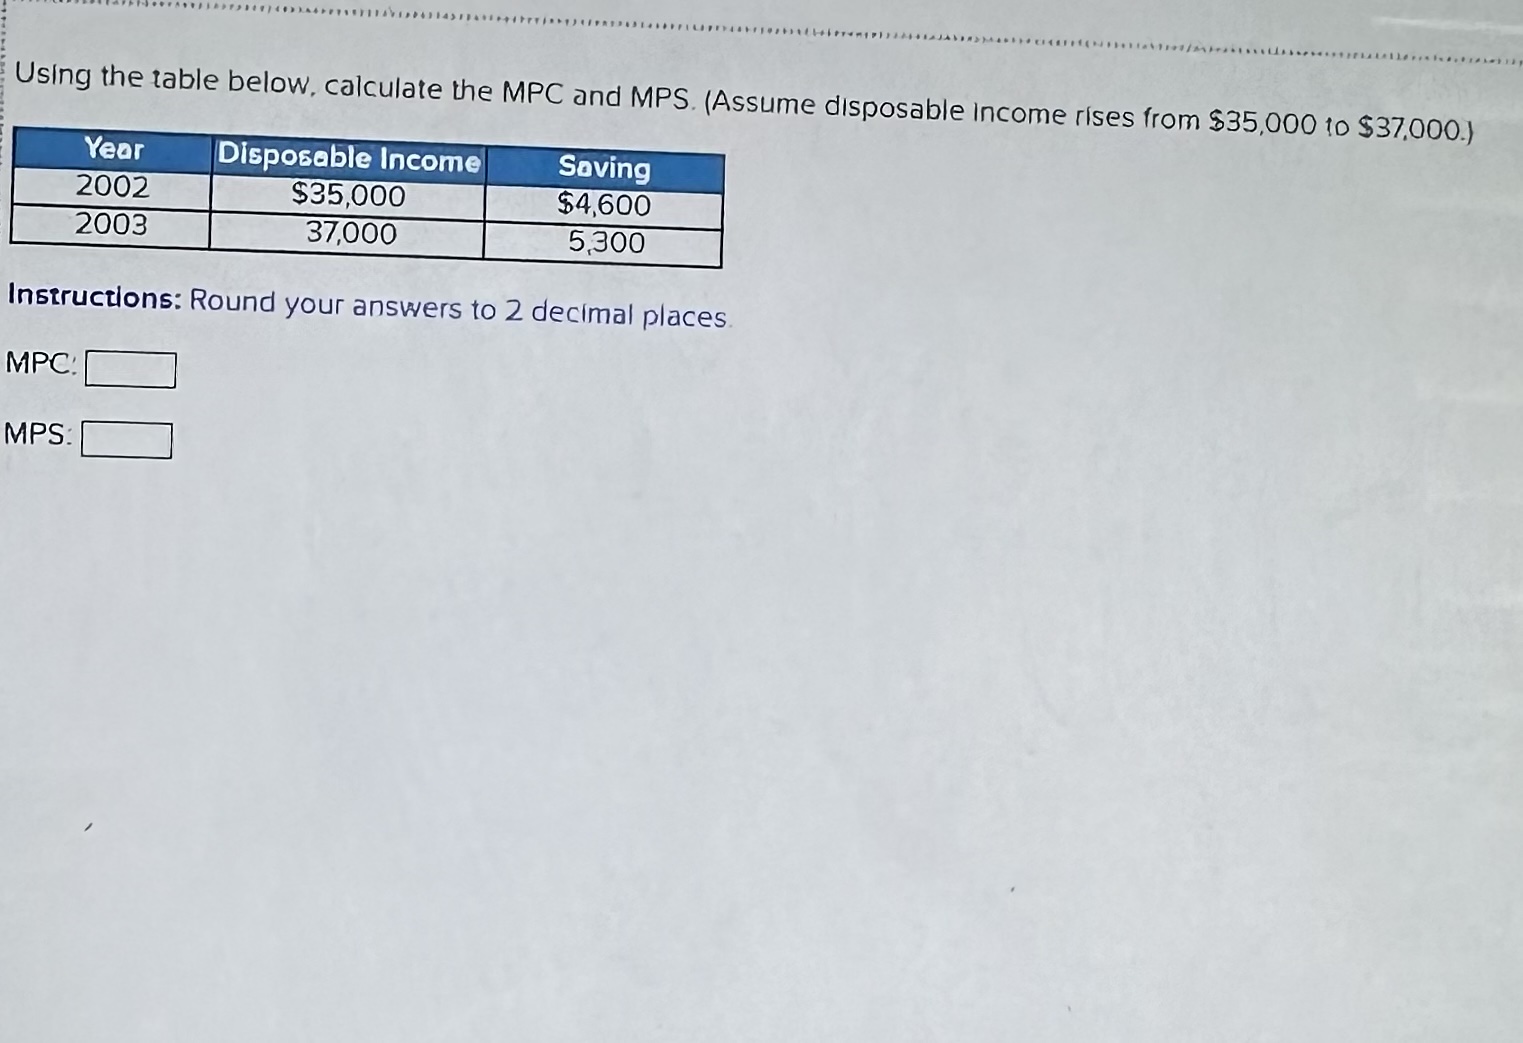
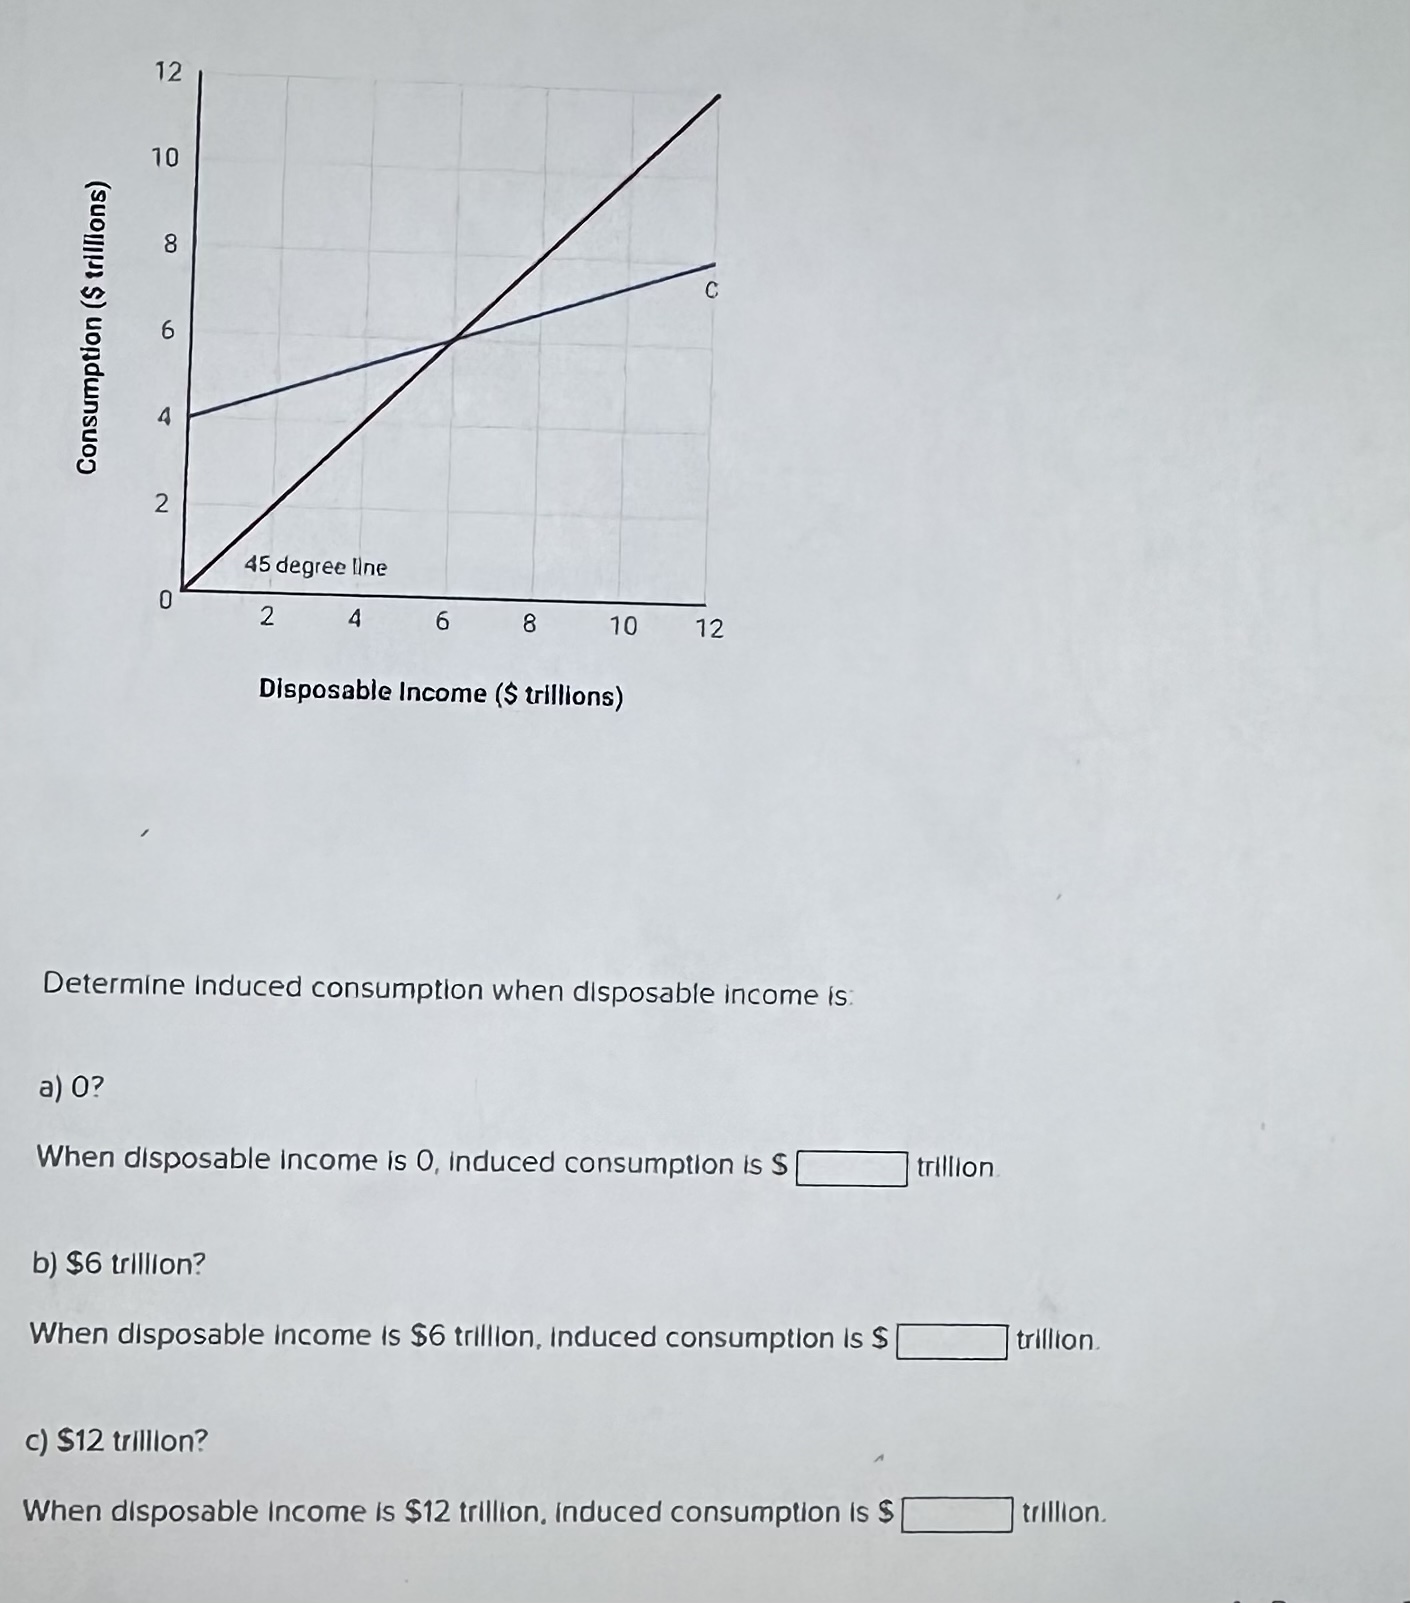
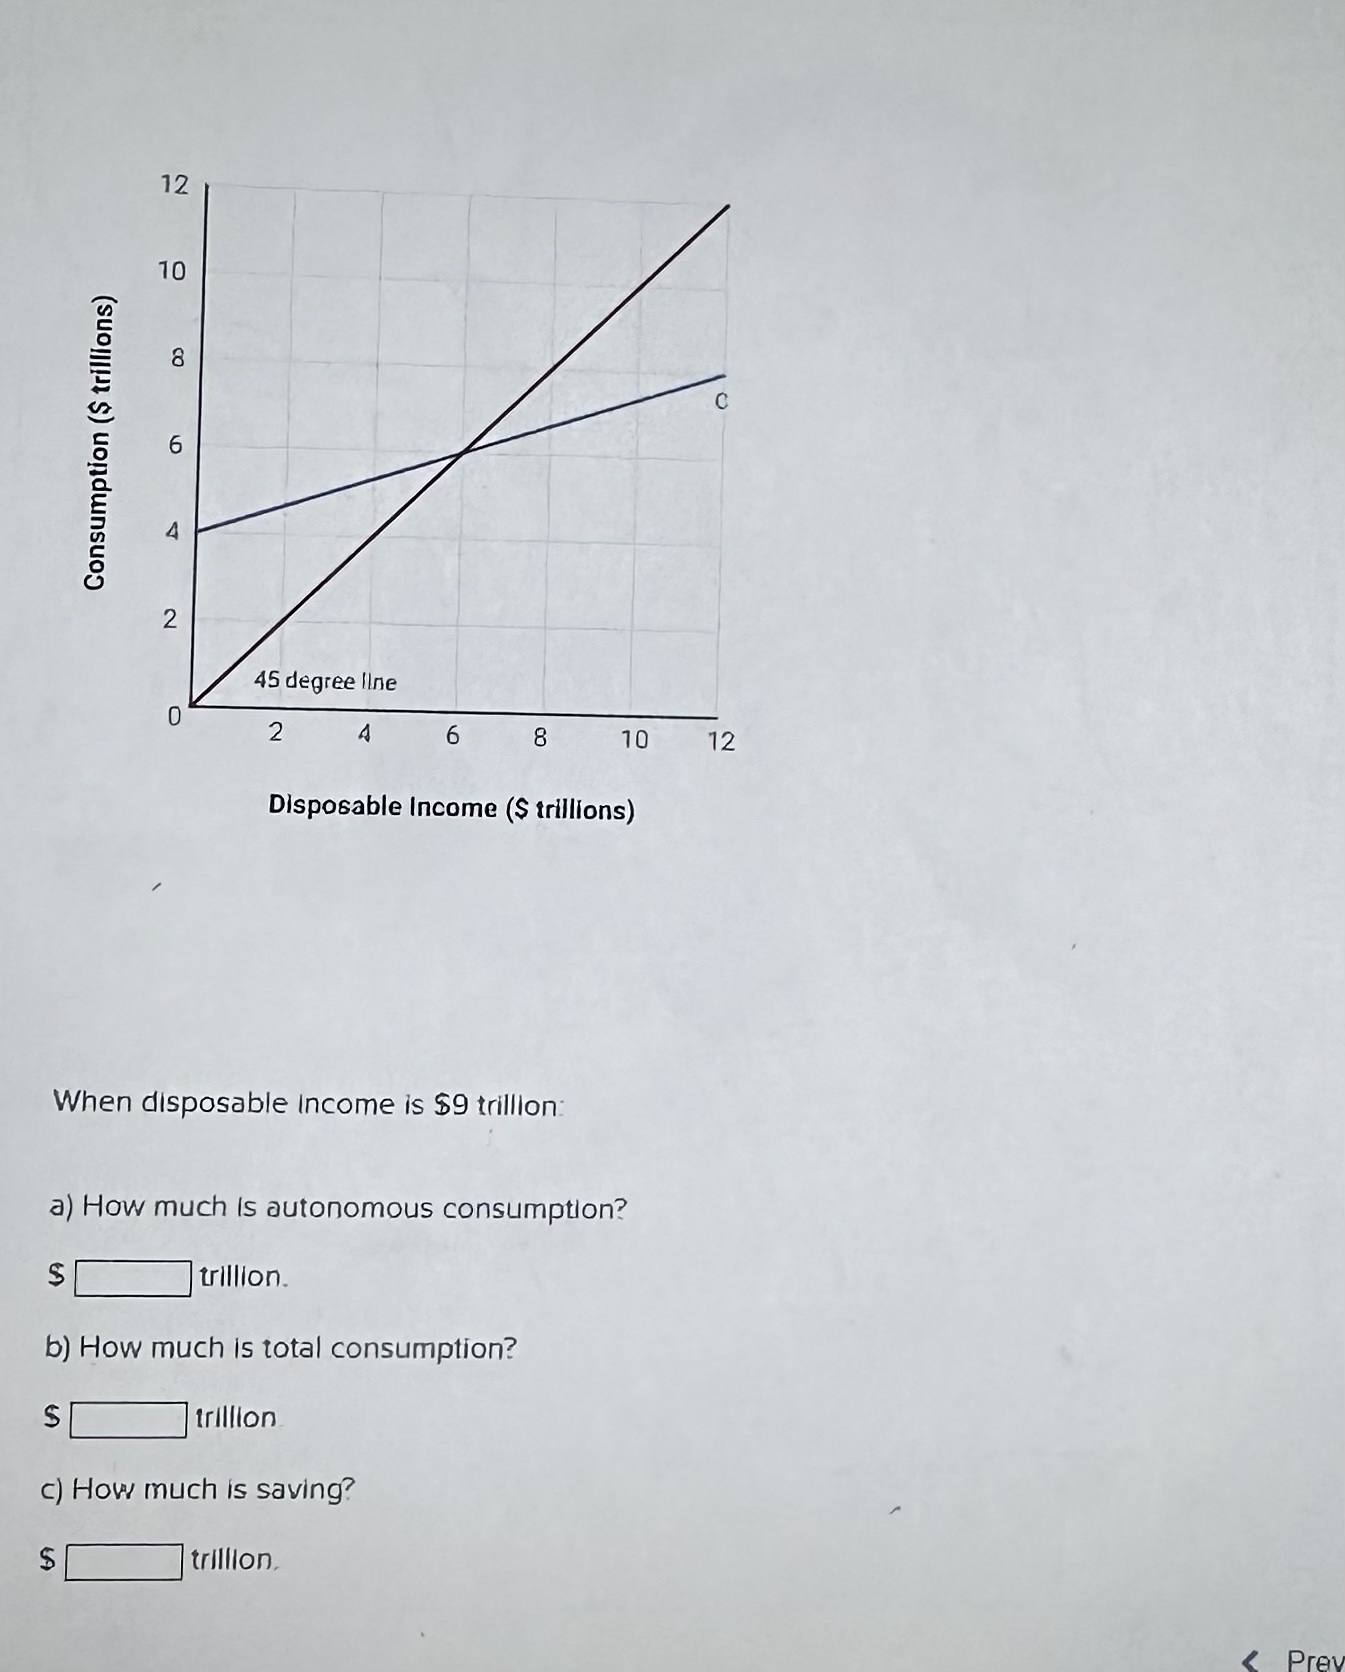
Using the table below, calculate the APC and the APS Disposable Income Consumption $10.000 $8,400 Instructions: Round your answers to 2 decimal places APC: APSUsing the table below, calculate the MPC and MPS. (Assume disposable income rises from $35,000 to $37,000.) Year Disposable Income Saving 2002 $35,000 $4,600 2003 37,000 5,300 Instructions: Round your answers to 2 decimal places. MPC. MPS12 10 00 Consumption ($ trillions) 6 A 2 45 degree line 2 4 6 8 10 12 Disposable Income ($ trillions) Determine Induced consumption when disposable income is a) 0? When disposable income is 0, induced consumption is S trillion b) $6 trillion? When disposable income is $6 trillion, induced consumption is $ trillion. c) $12 trillion? When disposable Income is $12 trillion, induced consumption is $ trillion.12 10 DO Consumption ($ trillions) 6 4 2 45 degree line 2 A 6 8 10 12 Disposable Income ($ trillions) When disposable Income is $9 trillion: a) How much is autonomous consumption? trillion. b) How much is total consumption? S trillion c) How much is saving? trillion, PreIn 2040, if our GDP were $40 trillion, estimate our level of consumption. $ billionCheck my work mode : This shows what is In 2040, if our GDP were $40 trillion, estimate our level of consumption. 14 billion 16:41
Step by Step Solution
There are 3 Steps involved in it

Get step-by-step solutions from verified subject matter experts