

Question: Using the table below, conduct a complete ratio analysis of the Bartett Company for the years 2018 and 2019. You should assess the firm's liquidity,
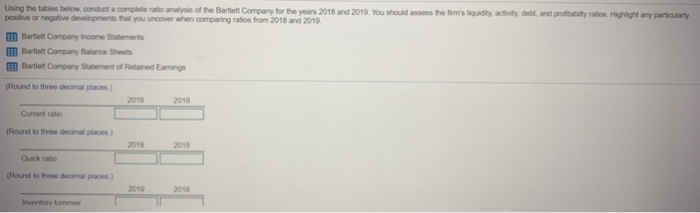
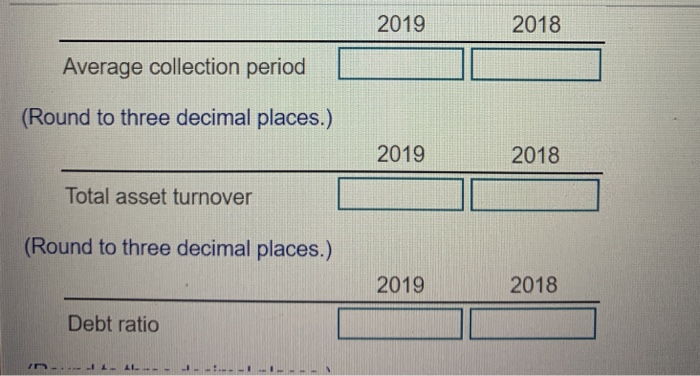
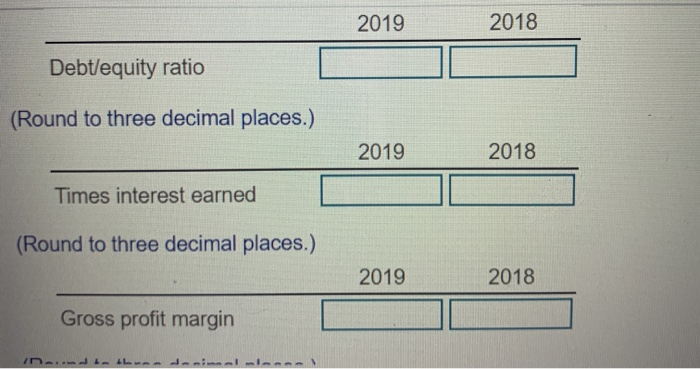
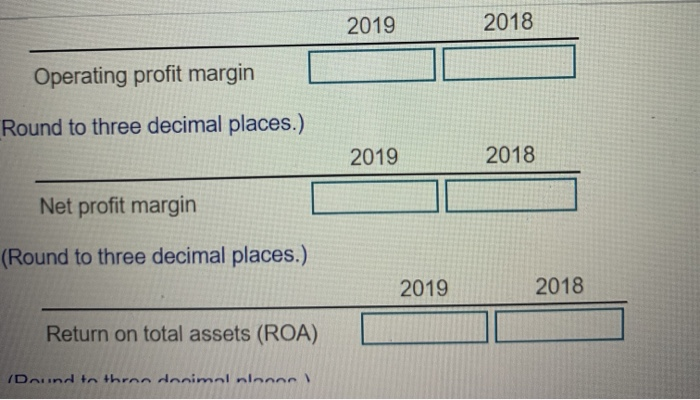
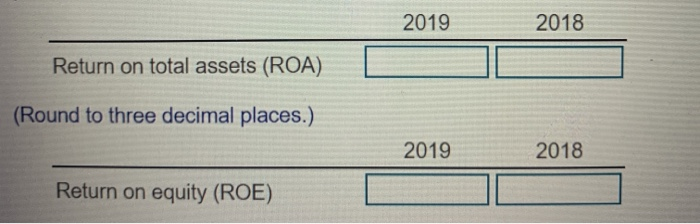
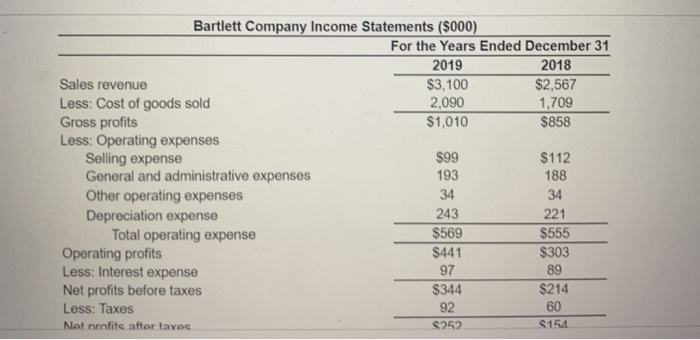
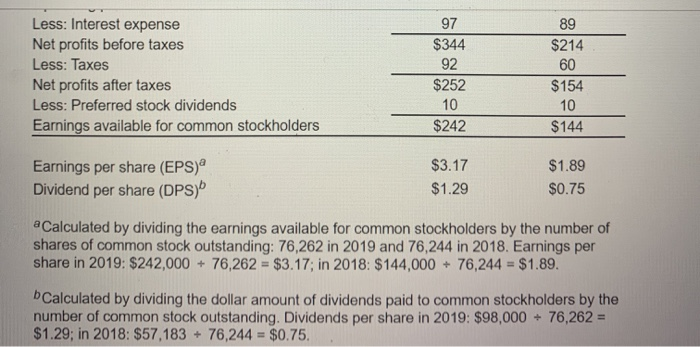
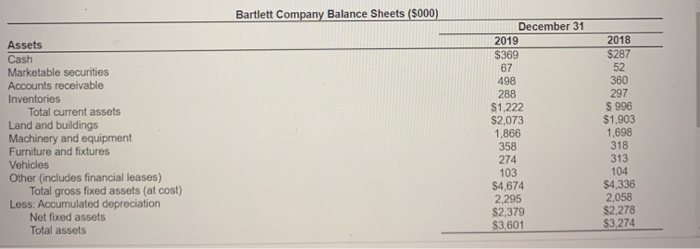
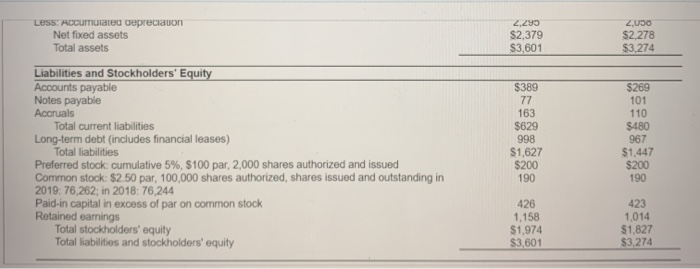
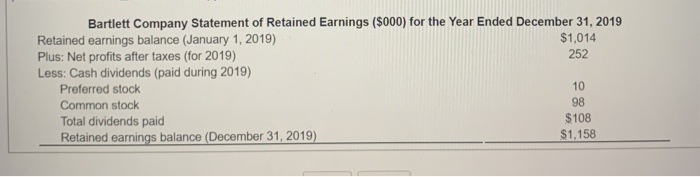
Using the table below, conduct a complete ratio analysis of the Bartett Company for the years 2018 and 2019. You should assess the firm's liquidity, activity, dett, and profitabity raton Highlight any particularly positive or negative developments that you uncover when comparing ratios from 2018 and 2019. Bartlett Company Income Statements Im Bartlett Company Balance Sheets Bartlett Company Statement of Retained Earings (Round to three decimal places) 2010 2018 Current ratio (Round to the decimal places 2010 2018 Quick (Round to three decimal places) 2019 2018 2019 2018 Average collection period (Round to three decimal places.) 2019 2018 Total asset turnover (Round to three decimal places.) 2019 2018 Debt ratio 2019 2018 Debt/equity ratio (Round to three decimal places.) 2019 2018 Times interest earned (Round to three decimal places.) 2019 2018 Gross profit margin in... L. 2019 2018 Operating profit margin Round to three decimal places.) 2019 2018 Net profit margin (Round to three decimal places.) 2019 2018 Return on total assets (ROA) /Dound to throno donimol nlnnor 2019 2018 Return on total assets (ROA) (Round to three decimal places.) 2019 2018 Return on equity (ROE) Bartlett Company Income Statements ($000) For the Years Ended December 31 2019 2018 Sales revenue $3,100 $2,567 Less: Cost of goods sold 2,090 1,709 Gross profits $1,010 $858 Less: Operating expenses Selling expense $99 $112 General and administrative expenses 193 188 Other operating expenses 34 34 Depreciation expense 243 221 Total operating expense $569 $555 Operating profits $441 $303 Less: Interest expense 97 89 Net profits before taxes $344 $214 Less: Taxes 92 60 Net profite after taves 252 154 Less: Interest expense Net profits before taxes Less: Taxes Net profits after taxes Less: Preferred stock dividends Earnings available for common stockholders 97 $344 92 $252 10 $242 89 $214 60 $154 10 $144 Earnings per share (EPS) Dividend per share (DPS)" $3.17 $1.29 $1.89 $0.75 a Calculated by dividing the earnings available for common stockholders by the number of shares of common stock outstanding: 76,262 in 2019 and 76,244 in 2018. Earnings per share in 2019: $242,000 + 76,262 = $3.17; in 2018: $144,000 + 76,244 = $1.89. bCalculated by dividing the dollar amount of dividends paid to common stockholders by the number of common stock outstanding. Dividends per share in 2019: $98,000 + 76,262 = $1.29; in 2018: $57,183 + 76,244 = $0.75 Bartlett Company Balance Sheets ($000) Assets Cash Marketable securities Accounts receivable Inventories Total current assets Land and buildings Machinery and equipment Furniture and fixtures Vehicles Other (includes financial leases) Total gross fixed assets (at cost) Less: Accumulated depreciation Net fixed assets Total assets December 31 2019 $369 67 498 288 $1,222 $2,073 1,866 358 274 103 $4,674 2,295 $2,379 $3,601 2018 $287 52 360 297 $ 996 $1,903 1,698 318 313 104 $4,336 2,058 $2,278 $3,274 2,295 S2,379 $3,601 2,050 $2,278 $3,274 LESS: HOC Tulated depreciauon Net fixed assets Total assets Liabilities and Stockholders' Equity Accounts payable Notes payable Accruals Total current liabilities Long-term debt (includes financial leases) Total liabilities Preferred stock cumulative 5%, $100 par, 2,000 shares authorized and issued Common stock: $2.50 par, 100,000 shares authorized, shares issued and outstanding in 2019: 76,262; in 2018: 76,244 Paid-in capital in excess of par on common stock Retained earnings Total stockholders' equity Total liabilities and stockholders' equity $389 77 163 $629 998 $1,627 $200 190 $269 101 110 $480 967 $1,447 $200 190 426 1.158 $1,974 $3,601 423 1,014 $1,827 $3,274 Bartlett Company Statement of Retained Earnings ($000) for the Year Ended December 31, 2019 Retained earnings balance (January 1, 2019) $1,014 Plus: Net profits after taxes (for 2019) 252 Less: Cash dividends (paid during 2019) Preferred stock 10 Common stock 98 Total dividends paid $108 Retained earnings balance (December 31, 2019) $1,158
Step by Step Solution
There are 3 Steps involved in it

Get step-by-step solutions from verified subject matter experts