

Question: Using the table below, describe completely each statistically significant relationship shown in the correlation matrix. Table 2: Correlation Matrix, GSS 2006 Hours per day Sex
Using the table below, describe completely each statistically significant relationship shown in the correlation matrix.
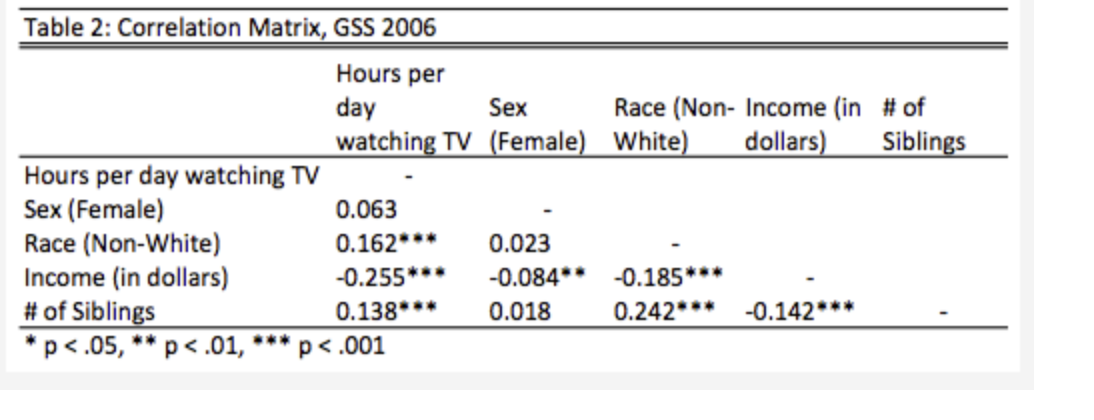
Table 2: Correlation Matrix, GSS 2006 Hours per day Sex Race (Non- Income (in # of watching TV (Female) White) dollars) Siblings Hours per day watching TV Sex (Female) 0.063 Race (Non-White) 0.162 0.023 Income (in dollars) -0.255* -0.084* * -0.185*** # of Siblings 0.138* ** 0.018 0.242* ** -0.142* ** * p <.05 p>
Step by Step Solution
There are 3 Steps involved in it
1 Expert Approved Answer
Step: 1 Unlock

Question Has Been Solved by an Expert!
Get step-by-step solutions from verified subject matter experts
Step: 2 Unlock
Step: 3 Unlock