

Question: Using the table below for returns and inflation look at the period from 1973 through 1978. A: Period calculate that arithmetic average return for the
Using the table below for returns and inflation look at the period from 1973 through 1978.
A: Period calculate that arithmetic average return for the large company stocks and T-bills over this period.
B: Calculate the standard deviation of returns for large company stocks and T-bills over this period.
C: Calculate the observed risk premium each year for large company stocks versus T-bills. What was the arithmetic average rich premium over this.? What was the standard deviation of the risk premium over this.?
D: Is it possible for the risk premium to be negative before an investment is undertaken? Can the risk premium be negative after the fact? Explain.
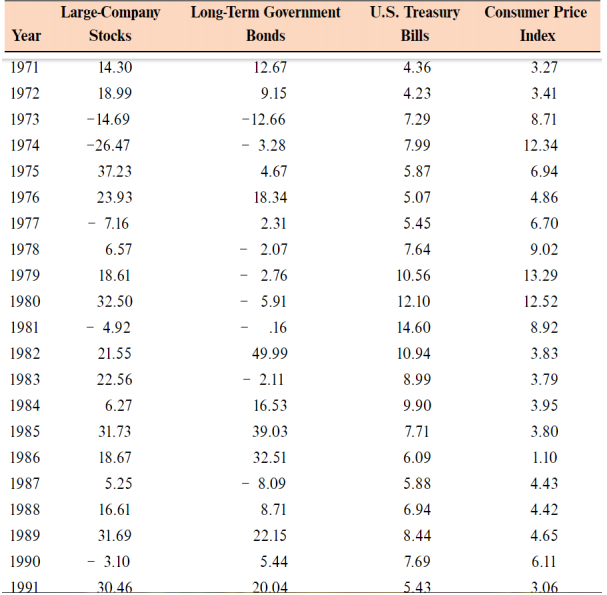
Large-Company Stocks Long-Term Government Bonds U.S. Treasury Bills Consumer Price Index 3.27 Year 1971 1972 1973 4.36 4.23 7.29 3.41 8.71 1974 7.99 12.34 6.94 4.86 1975 1976 1977 1978 14.30 18.99 - 14.69 -26.47 37.23 23.93 - 7.16 6.57 18.61 32.50 - 4.92 21.55 22.56 6.27 31.73 6.70 9.02 13.29 12.52 1979 12.67 9.15 -12.66 - 3.28 4.67 18.34 2.31 2.07 2.76 5.91 .16 49.99 - 2.11 16.53 39.03 32.51 - 8.09 8.71 22.15 1980 5.87 5.07 5.45 7.64 10.56 12.10 14.60 10.94 8.99 9.90 7.71 6.09 5.88 8.92 3.83 1981 1982 1983 1984 1985 1986 1987 1988 1989 3.79 3.95 3.80 18.67 1.10 5.25 4.43 16.61 31.69 6.94 8.44 7.69 4.42 4.65 1990 3.10 5.44 6.11 1991 30.46 20.04 5.43 3.06
Step by Step Solution
There are 3 Steps involved in it

Get step-by-step solutions from verified subject matter experts