

Question: Using the table below what would you conclude about the trends in admissions for at. Mary's hospital for calendar year 2018 Using the table below,
Using the table below what would you conclude about the trends in admissions for at. Mary's hospital for calendar year 2018
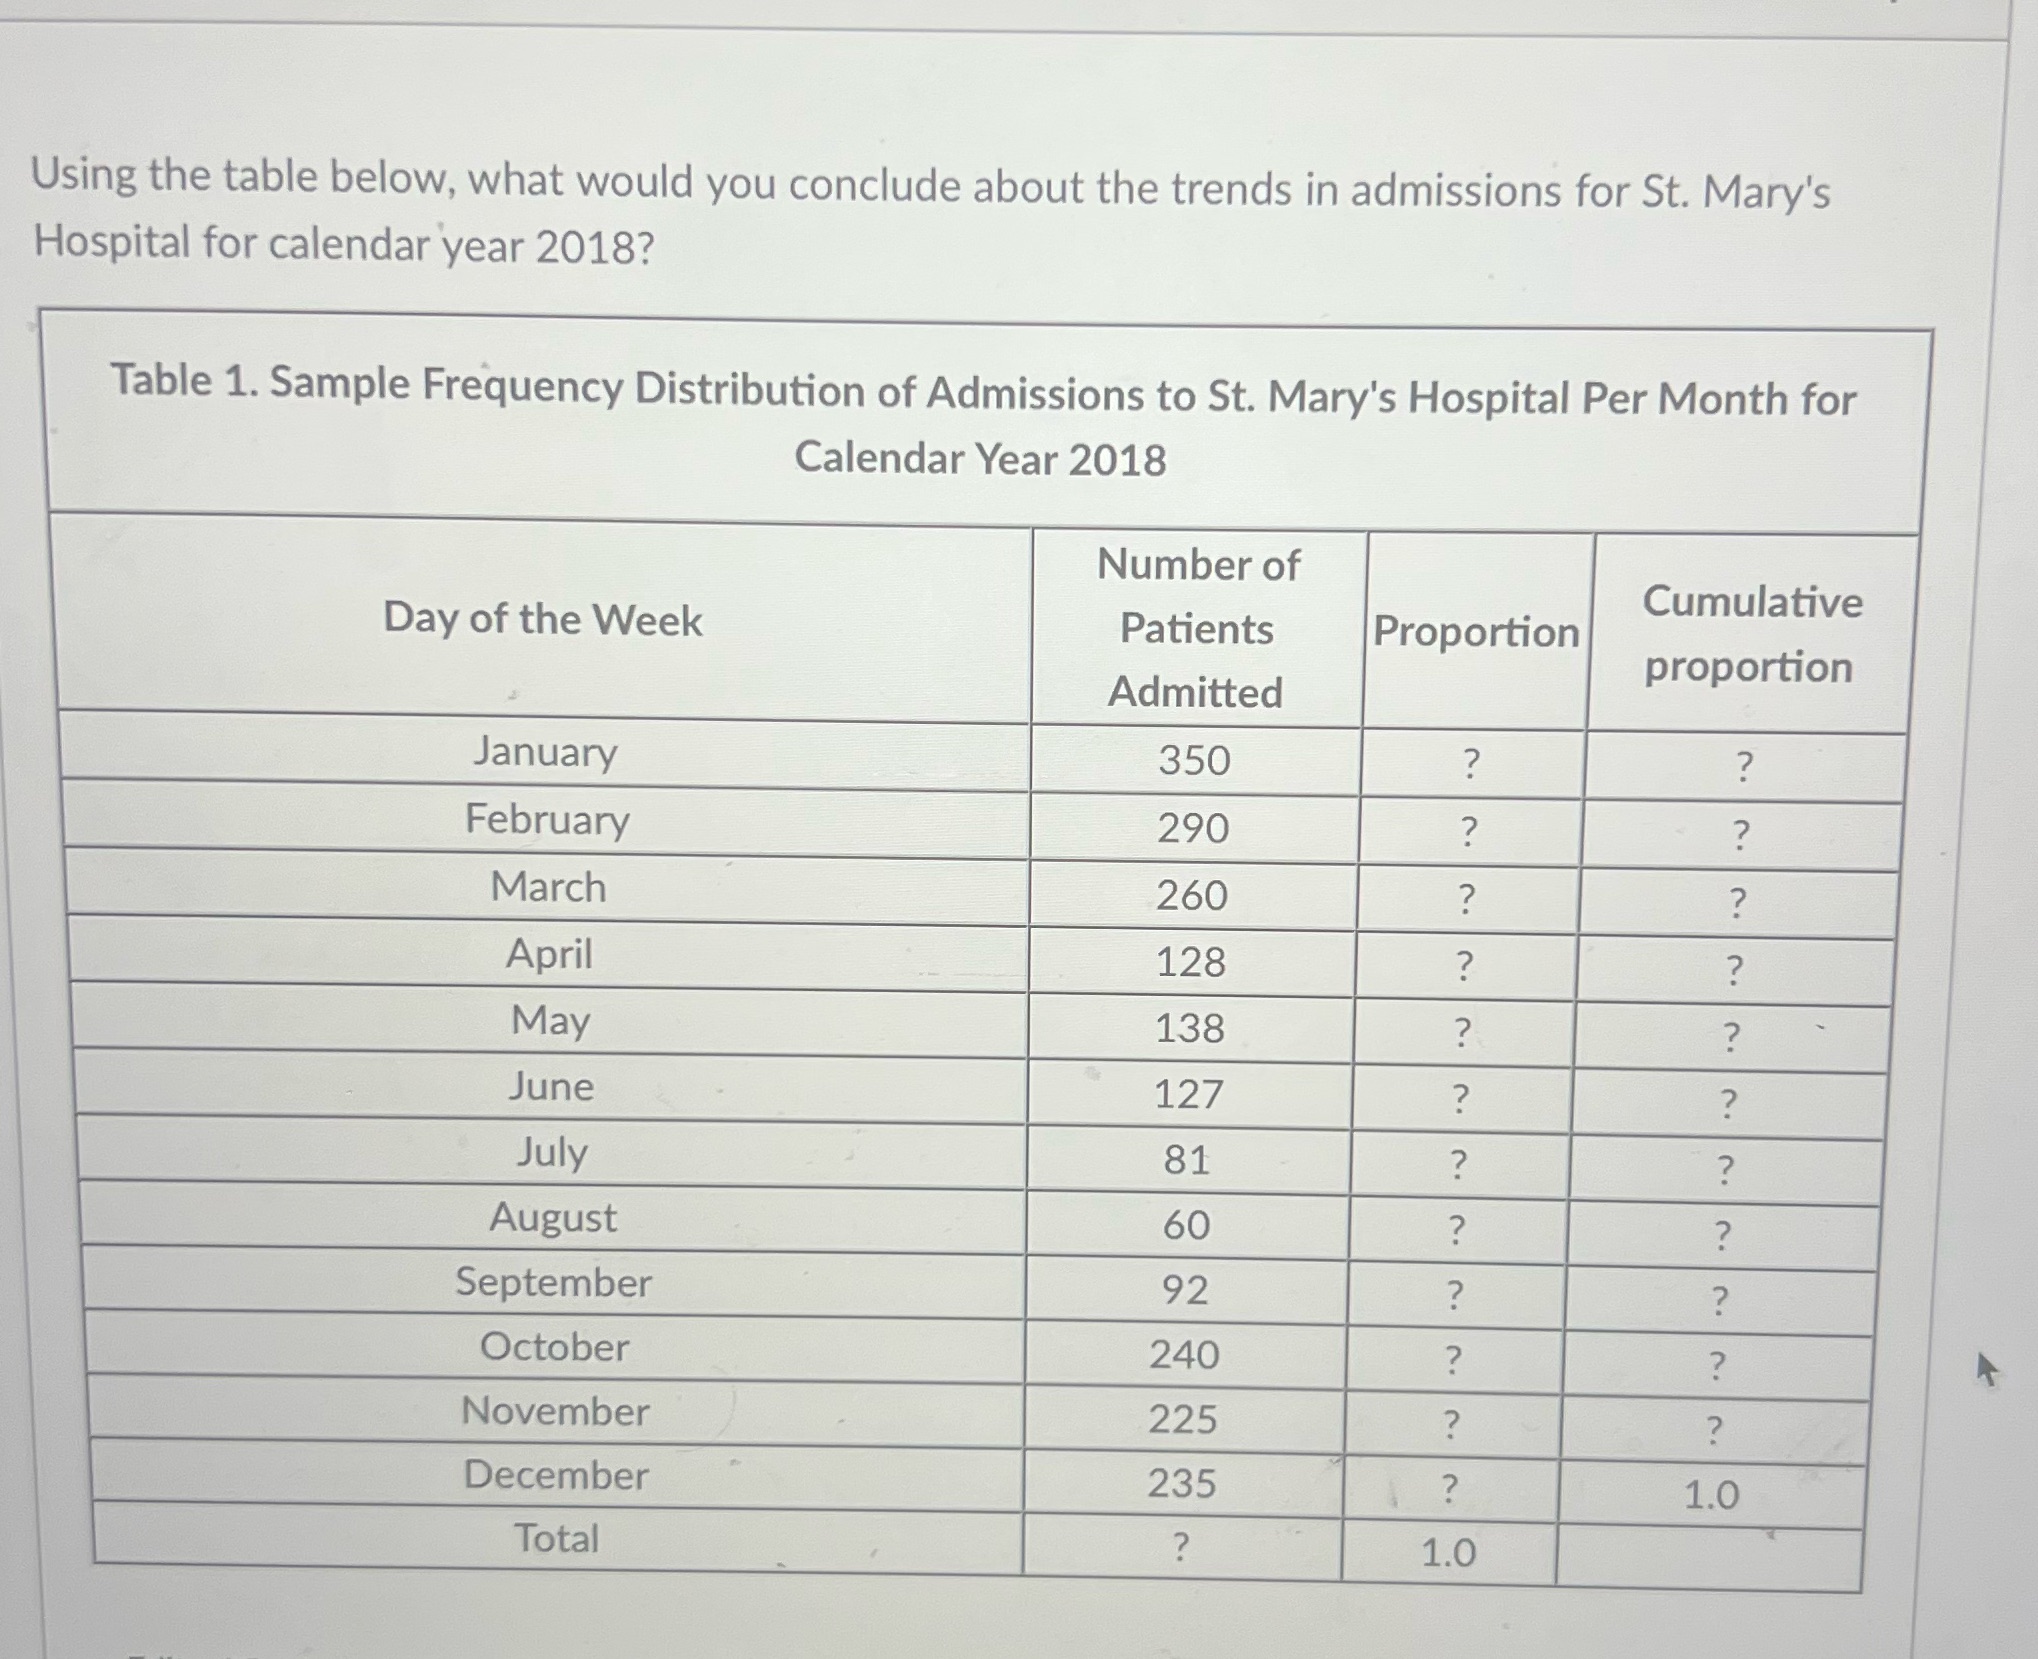
Using the table below, what would you conclude about the trends in admissions for St. Mary's Hospital for calendar year 2018? Table 1. Sample Frequency Distribution of Admissions to St. Mary's Hospital Per Month for Calendar Year 2018 Number of Cumulative Day of the Week Patients Proportion proportion Admitted January 350 . J . V February 290 . J . J March 260 . J . V April 128 . . V May 138 . V . V June 127 . V . V July 81 .V . V August 60 .V . V September 92 . V . V October 240 ? . V November 225 . J December 235 ? 1.O Total ? 1.0
Step by Step Solution
There are 3 Steps involved in it

Get step-by-step solutions from verified subject matter experts