

Question: Using the table I attached, answer my question Finished Goods in 2019 in Table 4 is calculated as The Increase in net working capital in
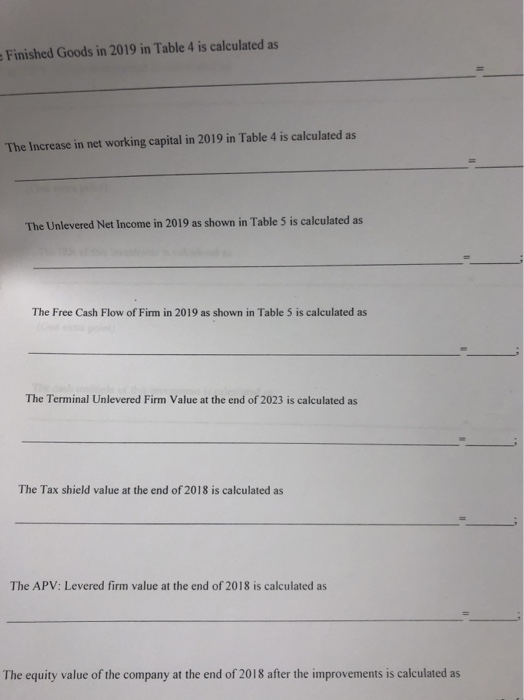
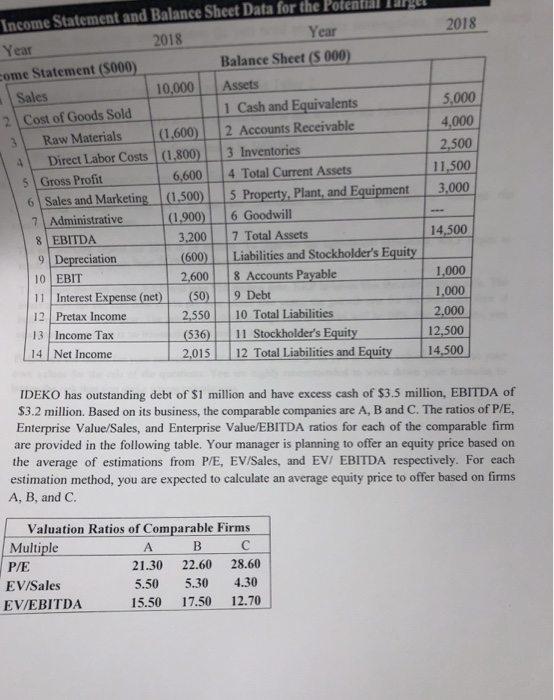
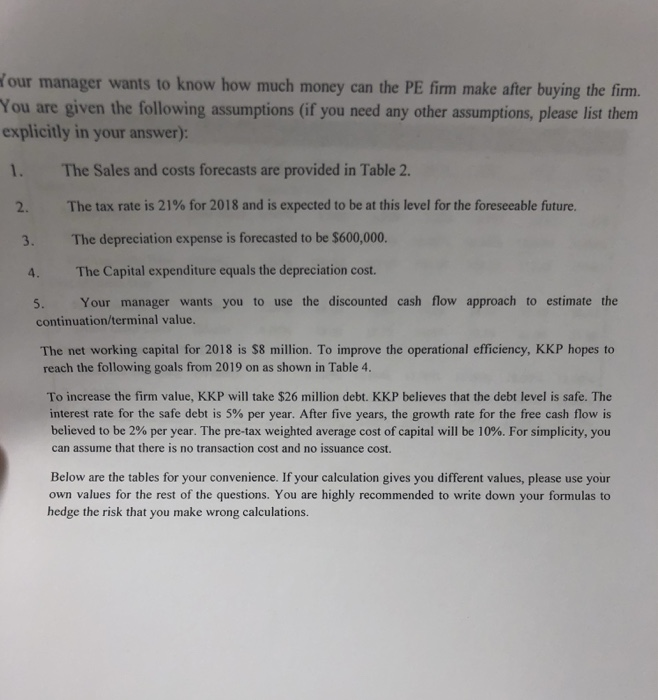
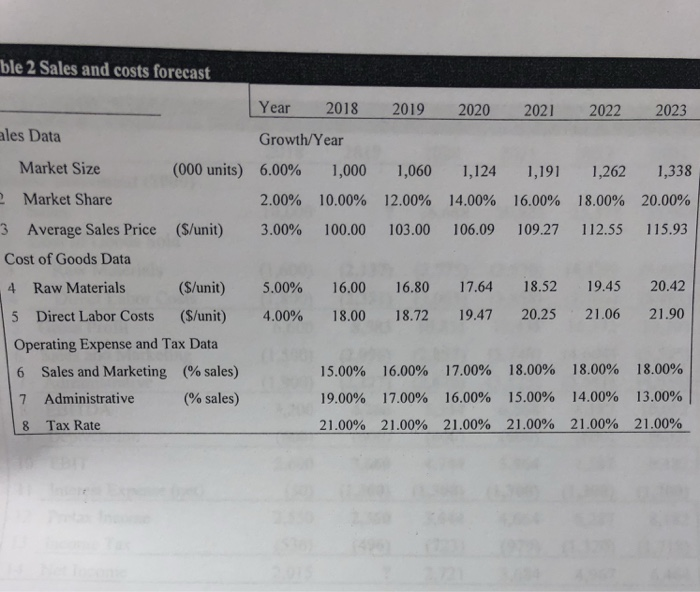
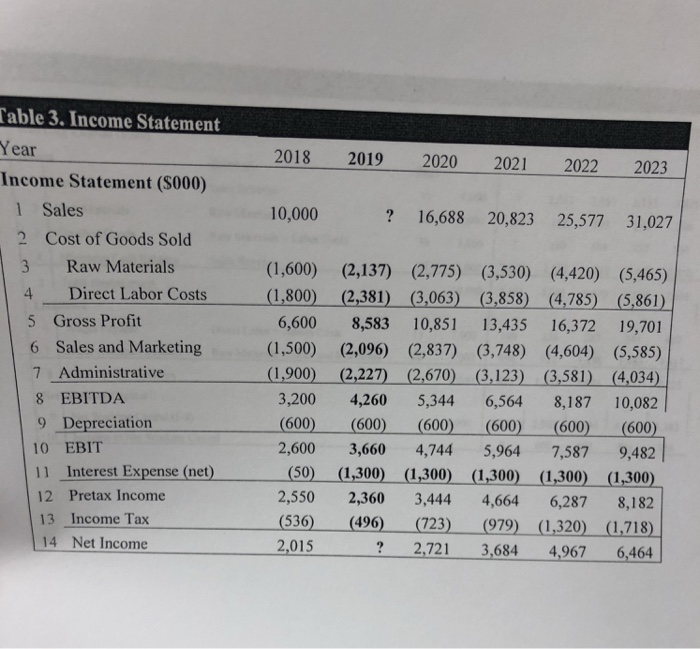
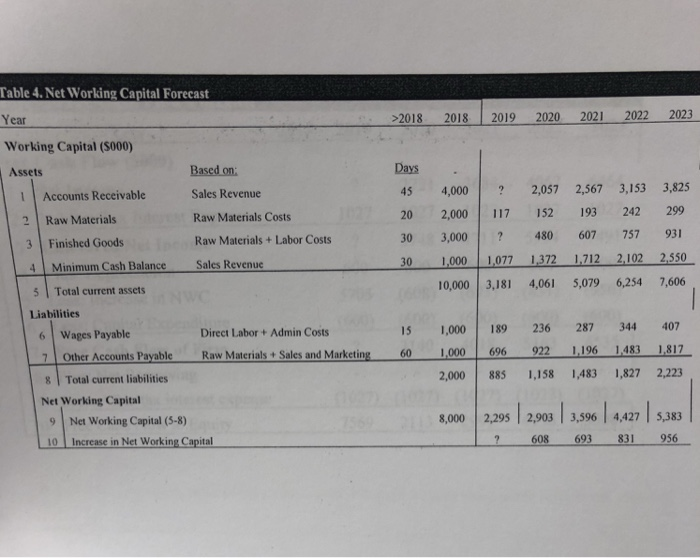
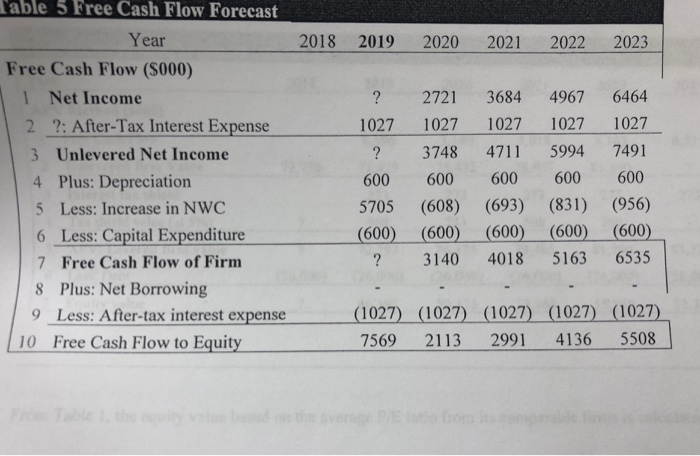
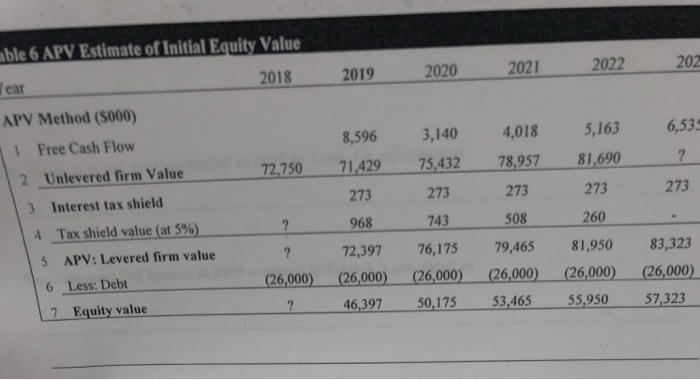
Finished Goods in 2019 in Table 4 is calculated as The Increase in net working capital in 2019 in Table 4 is calculated as The Unlevered Net Income in 2019 as shown in Table 5 is calculated as The Free Cash Flow of Firm in 2019 as shown in Table 5 is calculated as The Terminal Unlevered Firm Value at the end of 2023 is calculated as The Tax shield value at the end of 2018 is calculated as The APV: Levered firm value at the end of 2018 is calculated as The equity value of the company at the end of 2018 after the improvements is calculated as Income Statement and Balance Sheet Data for the Potential Targe Year ome Statement ($000) 2018 Year 2018 Balance Sheet ($ 000) Sales 10,000Assets 1 Cash and Equivalents 3Raw Materials (1,600) 2 Accounts Receivable 5,000 4,000 2,500 2Cost of Goods Sold 13 Inventories 6,6004 Total Current Assets Direct Labor Costs |(1.800)1 5 Gross Profit 11,500 6Sales and Marketing (1.s0o)5 Property,Plant, and Equipment 3,000 7 Administrative 8 EBITDA 9 Depreciation 10 EBIT 1.900) I 16 Goodwill 3,200 7 Total Assets (600) Liabilities and Stockholder's Equity 14,500 2,600 8 Accounts Payable 1,000 1,000 2,000 12,500 2015 12 Total Liabilities and Equity 14500 11 Interest Expense (net)(50) 9 Debt 12 Pretax Income 13 Income Tax 14 Net Income 2.550 10 Total Liabilities (536 11 Stockholder's Equity IDEKO has outstanding debt of S1 million and have excess cash of $3.5 million, EBITDA of 53.2 million. Based on its business, the comparable companies are A, B and C. The ratios of P/E Enterprise Value/Sales, and Enterprise Value/EBITDA ratios for each of the comparable firm are provided in the following table. Your manager is planning to offer an equity price based on the average of estimations from P/E, EV/Sales, and EV/ EBITDA respectively. For each estimation method, you are expected to calculate an average equity price to offer based on firms A, B, and C. Valuation Ratios of Comparable Firms Multiple P/E BC A 21.30 22.60 28.60 5.50 5.30 4.30 15.50 17.50 12.70 EV/Sales EVEBITDA our manager wants to know how much money can the PE firm make after buying the firm. You are given the following assumptions (if you need any other assumptions, please list them explicitly in your answer): 1 The Sales and costs forecasts are provided in Table 2. 2. The tax rate is 21% for 2018 and is expected to be at this level for the foreseeable future. 3. The depreciation expense is forecasted to be $600,000. 4. The Capital expenditure equals the depreciation cost. 5. Your manager wants you to use the discounted cash flow approach to estimate the continuation/terminal value. The net working capital for 2018 is $8 million. To improve the operational efficiency, KKP hopes to reach the following goals from 2019 on as shown in Table 4. To increase the firm value, KKP will take $26 million debt. KKP believes that the debt level is safe. The interest rate for the safe debt is 5% per year. After five years, the growth rate for the free cash flow is believed to be 2% per year. The pre-tax weighted average cost of capital will be 10%. For simplicity, you can assume that there is no transaction cost and no issuance cost. Below are the tables for your convenience. If your calculation gives you different values, please use your own values for the rest of the questions. You are highly recommended to write down your formulas to hedge the risk that you make wrong calculations. ble 2 Sales and costs forecast Year 2018 2019 2020 2021 2022 2023 Growth/Year les Data Market Size (000 units) 6.00% 1,000 1,060 1,124 1,191 1,262 1,338 2.00% 10.00% 12.00% 14.00% 16.00% 18.00% 20.00% 115.93 Market Share 3 Average Sales Price ($/unit) 3.00% 100.00 103.00 106.09 109.27 112.55 Cost of Goods Data 4 Raw Materials 5 Direct Labor Costs ($/unit) Operating Expense and Tax Data 6 Sales and Marketing (% sales) 7 Administrative (%sales) 18 Tax Rate ($/unit) 5.00% 16.00 16.80 17.64 18.52 19.45 20.42 4.00% 18.00 18.72 19.47 20.25 21.06 21.90 15.00% 19.00% 21.00% 16.00% 17.00% 21.00% 17.00% 16.00% 21.00% 18.00% 15.00% 21.00% 18.00% 14.00% 21.00% 18.00% 13.00% 21.00% Table 3. Income Statement Year Income Statement (S000) 2018 2019 2020 2021 2022 2023 1 Sales 2 Cost of Goods Sold 3 Raw Materials 4 Direct Labor Costs 5 Gross Profit 6 10,000 ? 16,688 20,823 25,577 31,027 (1,600) (2,137) (2,775) (3,530) (4,420) (5,465) Sales and Marketing 7 Administrative 8 EBITDA 9 Depreciation 10 EBIT 11 Interest Expense (net) 12 Pretax Income 13 Income Tax 14 Net lncome (1,800) (2,381) (3,063) (3,858) (4,785) (5,861) 6,600 8,583 10,851 13,435 16,372 19,701 (1,500) (2,096) (2,837) (3,748) (4,604) (5,585) (1,900) (2,227) (2,670) (3,123) (3,581) (4,034) 3,200 4,260 5,344 6,564 8,187 10,082 (600) (600) (600) (600) (600) (600) 2,600 3,660 4,744 5,964 7,587 9,482 (50 (1.300) (1300) (1300) (1300) (1300) 2,550 2,360 3,444 4,664 6,287 8,182 (536) (496) (723) (979) (1,320) (1.718) ? 2,721 3.684 6,464 (1 2,015 ? 2,721 3,684 4,967 6,464 Table 4. Net Working Capital Forecast Year Working Capital ($000) Assets >2018 2018 2019 2020 2021 2022 2023 Days Based on: Sales Revenue Raw Materials Costs Raw Materials + Labor Costs 45 4,000 2,057 2,567 3,153 3,825 20 2,000 117 152 193 242 299 1Accounts Receivable 2 Raw Materials 30 3,000480 607 757 93 3 Finished Goods 4 Minimum Cash Balance Sales Revenue 5 | Total current assets Liabilities 30 1,0001077 1372 1712 2,102 2550 7,606 10,000 3,181 4,061 5,079 6,254 15 1,000 189 236 287 344 407 696 922 1196 1483 1817 2,000 885 1,158 1,483 1,827 2,223 Direct Labor + Admin Costs 6 Wages Payable 7 Other Accounts Payable Raw Materials Sales and Marketing60 1,000 8 | Total current liabilities Net Working Capital 9 Net Working Capital (5-8) 10 Increase in Net Working Capital 8,000 2,295 2,903 3,596 4,427 5,383 608 693 831 956 able 5 Free Cash Flow Forecast Year 2018 2019 2020 2021 2022 2023 Free Cash Flow ($000) 1 Net Income ? 2721 3684 4967 6464 1027 1027 1027 1027 1027 ? 3748 4711 5994 7491 600 600 600 600 600 5705 (608) (693) (831) (956) (600) (600) (600) (600) (600) ? 3140 4018 5163 6535 2 2: After-Tax Interest Expense 3 Unlevered Net Income 4 Plus: Depreciation 5 Less: Increase in NWC 6 Less: Capital Expenditure 7 Free Cash Flow of Firm 8 Plus: Net Borrowing 9 Less: After-tax interest expense (1027) 1027) (1027) (1027) (1027) 7569 2113 2991 4136 5508 10 Free Cash Flow to Equity ble 6 APV Estimate of Initial Equity Value l ear APV Method ($000) 202 2018 2019 2020 20212 8,596 3,140 4,018 5,163 6,53 Free Cash Flow 1 2 Unlevered firm Value 3 Interest tax shield 4 72,750 71429 75,432 78,957 81,690 273 273 273 273 273 968 743 508 260 Tax shield value (at 5%) 72,397 76,175 79,465 81,950 83,323 APV: Levered firm value 6 Less: Debt 7 Equity value 5 26,000) (26,000) (26,000) (26,000) (26,000) 26,000) 46,397 50,175 53,465 55,950 57,323
Step by Step Solution
There are 3 Steps involved in it

Get step-by-step solutions from verified subject matter experts