

Question: Using the table of values below, create a graph of displacement as a function of time (displacement vs. time). When we say apples vs oranges,
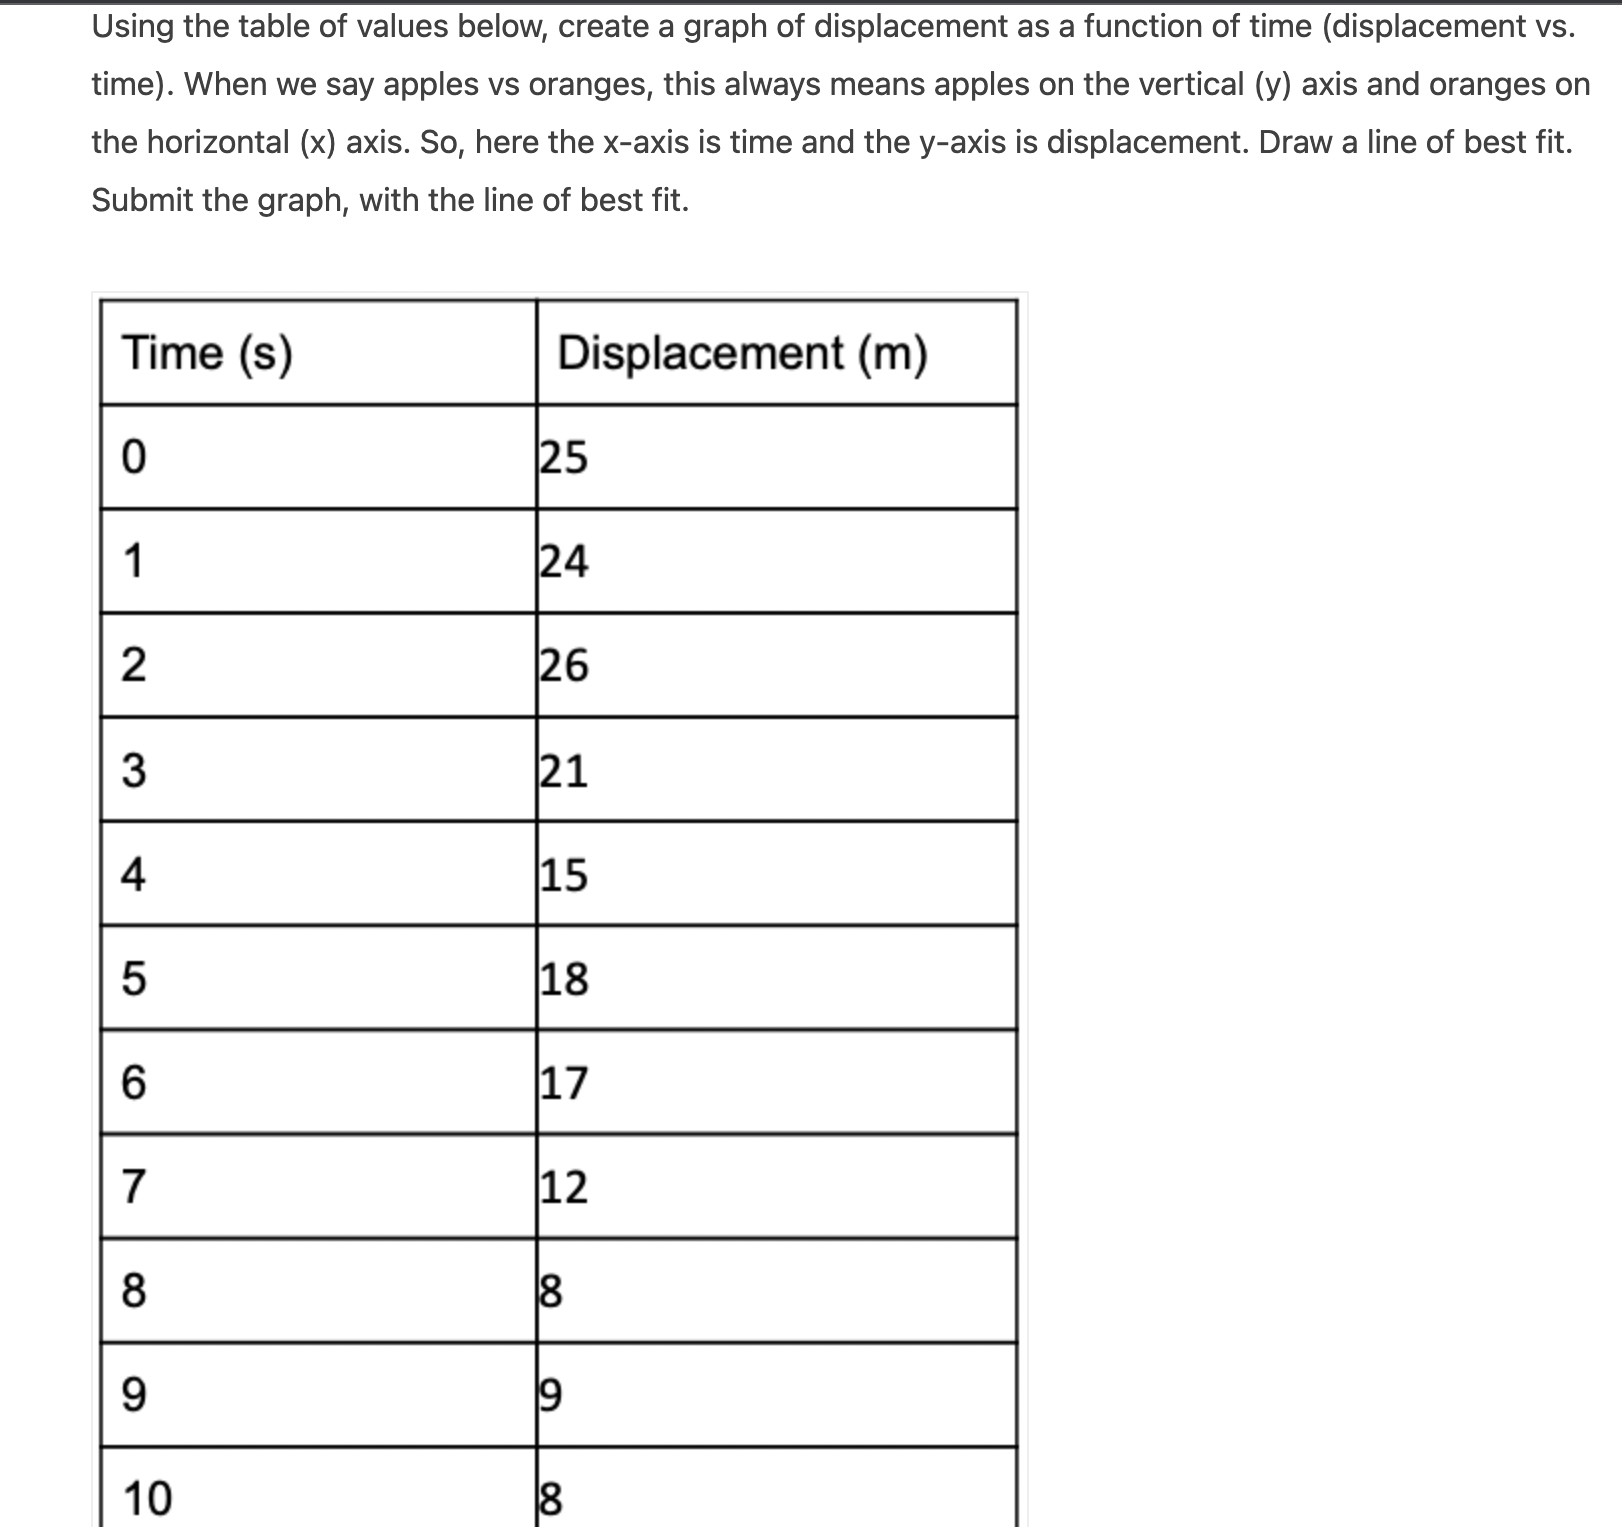


Using the table of values below, create a graph of displacement as a function of time (displacement vs. time). When we say apples vs oranges, this always means apples on the vertical (y) axis and oranges on the horizontal (x) axis. So, here the x-axis is time and the y-axis is displacement. Draw a line of best fit. Submit the graph, with the line of best fit. Displacement (m) NNW _ __ __ __ _ _ _ _ __ Exercise 2: Calculation Calculate the slope of the line of best fit that you drew in Exercise 1. Show your work
Step by Step Solution
There are 3 Steps involved in it
1 Expert Approved Answer
Step: 1 Unlock

Question Has Been Solved by an Expert!
Get step-by-step solutions from verified subject matter experts
Step: 2 Unlock
Step: 3 Unlock