

Question: Using the table provided below: 1. Formulate a hypothesis Calculate the chi-square Report the test statistic, df, and p-value continues Table 18.12 Observed and expected
Using the table provided below: 1. Formulate a hypothesis
- Calculate the chi-square
- Report the test statistic, df, and p-value
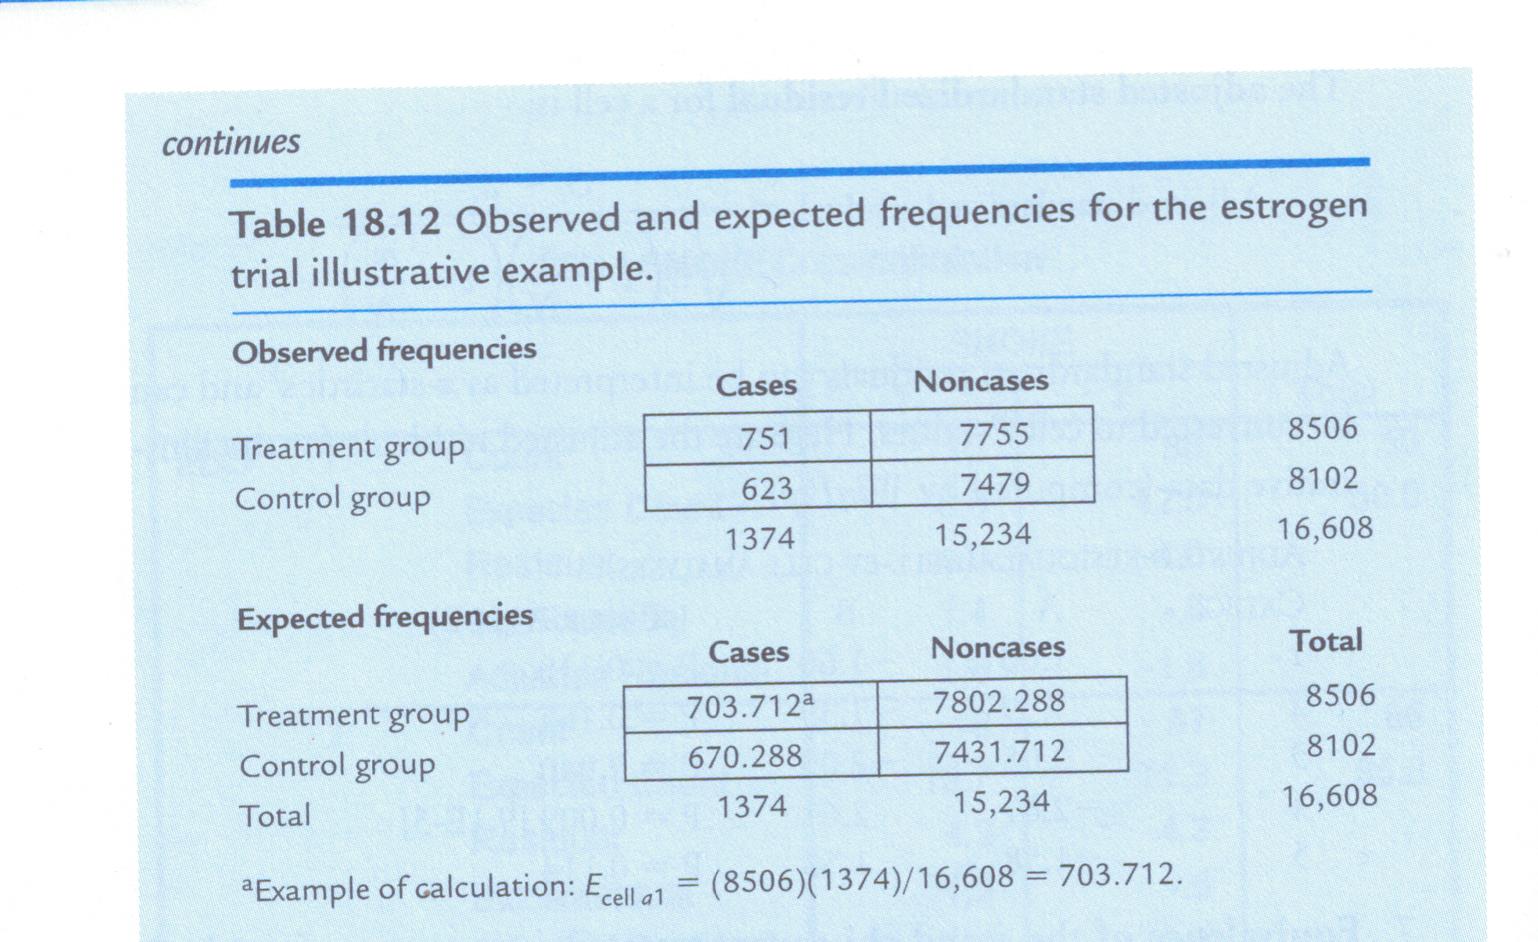
continues Table 18.12 Observed and expected frequencies for the estrogen trial illustrative example. Observed frequencies Cases Noncases Treatment group 751 7755 8506 Control group 623 7479 8102 1374 15,234 16,608 Expected frequencies Cases Noncases Total Treatment group 703.712a 7802.288 8506 Control group 670.288 7431.712 8102 Total 1374 15,234 16,608 a Example of calculation: Ecell al = (8506)(1374)/16,608 = 703.712
Step by Step Solution
There are 3 Steps involved in it
1 Expert Approved Answer
Step: 1 Unlock

Question Has Been Solved by an Expert!
Get step-by-step solutions from verified subject matter experts
Step: 2 Unlock
Step: 3 Unlock