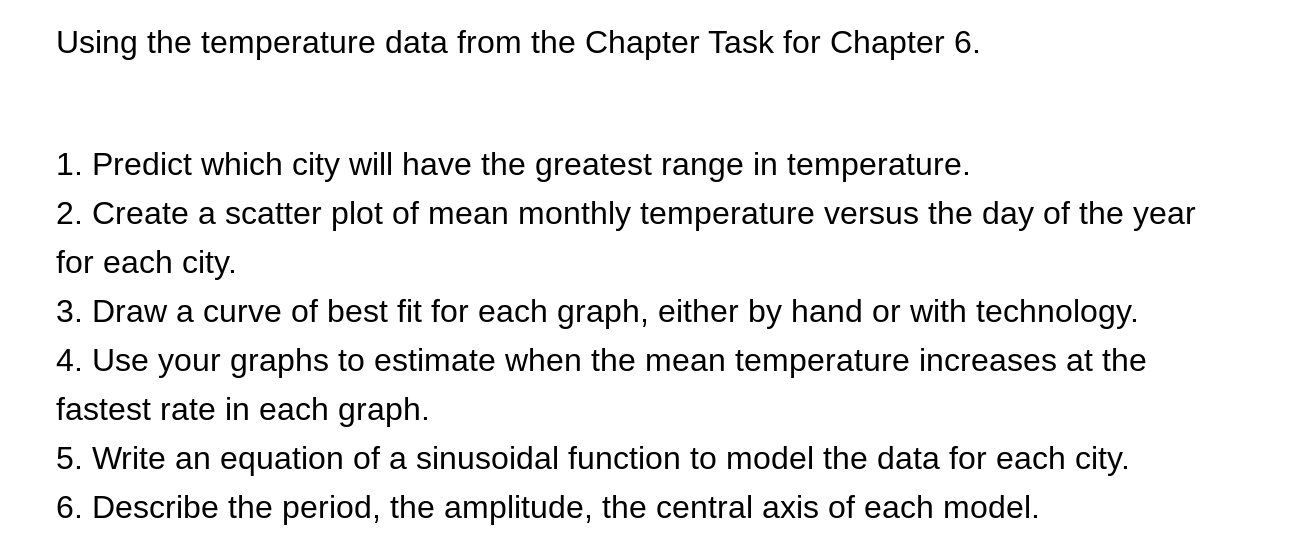
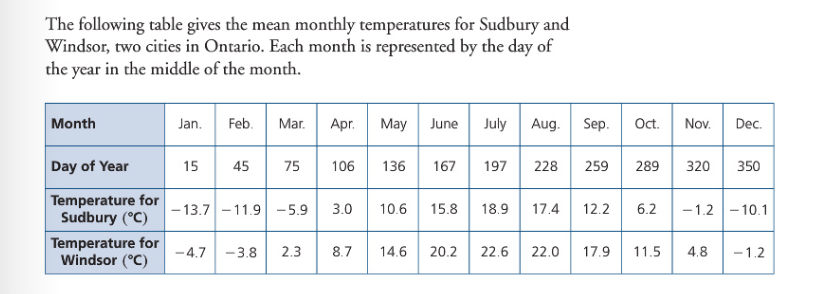
Question: Using the temperature data from the Chapter Task for Chapter 6. 1. Predict which city will have the greatest range in temperature. 2. Create a

Using the temperature data from the Chapter TaskUsing the temperature data from the Chapter Task
Using the temperature data from the Chapter Task for Chapter 6. 1. Predict which city will have the greatest range in temperature. 2. Create a scatter plot of mean monthly temperature versus the day of the year for each city. 3. Draw a curve of best fit for each graph, either by hand or with technology. 4. Use your graphs to estimate when the mean temperature increases at the fastest rate in each graph. 5. Write an equation of a sinusoidal function to model the data for each city. 6. Describe the period, the amplitude, the central axis of each model. The following table gives the mean monthly temperatures for Sudbury and Windsor, two cities in Ontario. Each month is represented by the day of the year in the middle of the month. Month Jan. Feb. Mar. Apr. May June July Aug. Sep. Oct. Nov. Dec. Day of Year 15 45 75 106 136 167 197 228 259 289 320 350 Temperature for Sudbury (C) -13.7 -11.9 -5.9 3.0 10.6 15.8 18.9 17.4 12.2 6.2 - 1.2 -10.1 Temperature for Windsor (C) -4.7 -3.8 2.3 8.7 14.6 20.2 22.6 22.0 17.9 11.5 4.8 -1.2

Step by Step Solution

There are 3 Steps involved in it

1 Expert Approved Answer
Step: 1 Unlock blur-text-image
Question Has Been Solved by an Expert!

Get step-by-step solutions from verified subject matter experts

Step: 2 Unlock
Step: 3 Unlock

Students Have Also Explored These Related Mathematics Questions!