

Question: Using the three charts below: Does the annual sales boxplot look symmetric? Would you prefer the IQR instead of the standard deviation to describe the
Using the three charts below:
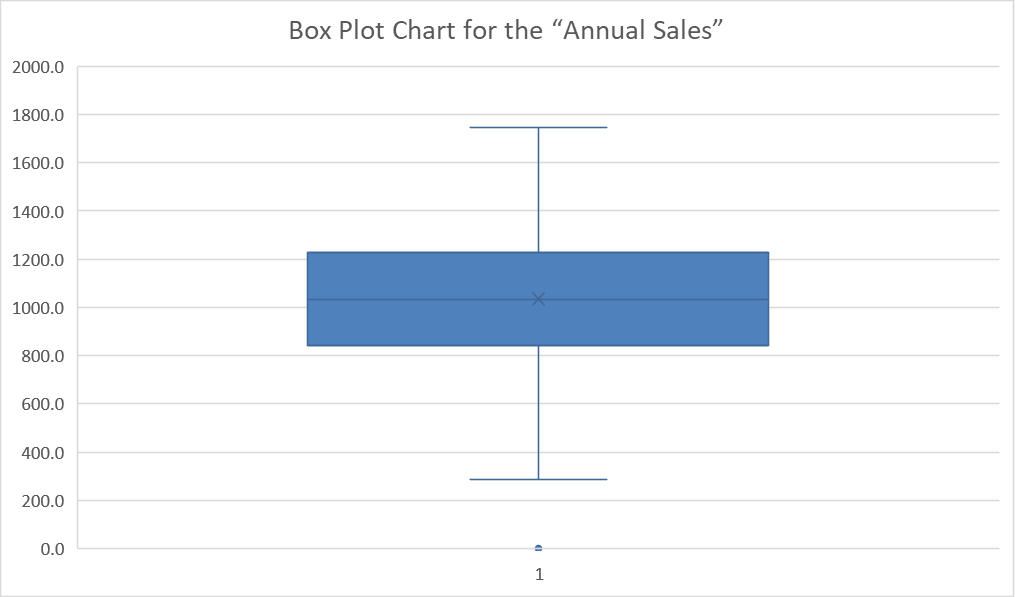
- Does the annual sales boxplot look symmetric?
- Would you prefer the IQR instead of the standard deviation to describe the dispersion of the annual sales variable? If so, why?
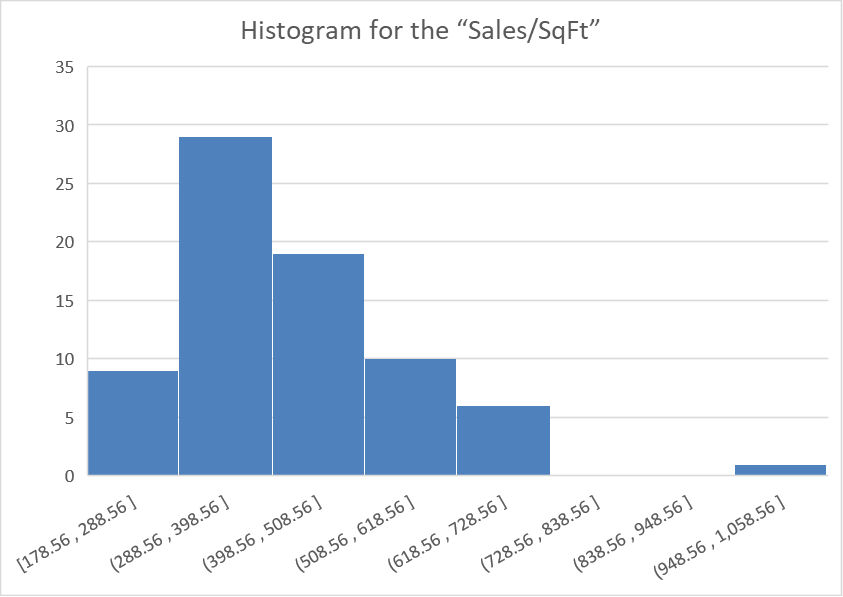
- Does the histogram show that the sales per square foot distribution is symmetric?
- If the sales per square foot distribution is not symmetric, what is the skew?
- If there are any outliers, which one(s)? What is the "SqFt" area of the outlier(s)?
- Is the outlier(s) smaller or larger than the average restaurant in the data? What can you conclude from this observation?
- What measure of central tendency may be more appropriate to describe "Sales/SqFt"? Why?
Step by Step Solution
There are 3 Steps involved in it
1 Expert Approved Answer
Step: 1 Unlock

Question Has Been Solved by an Expert!
Get step-by-step solutions from verified subject matter experts
Step: 2 Unlock
Step: 3 Unlock