

Question: Using the time series in the following table, estimate the consumption function and the savings function (in linear form) of the U.K. What is
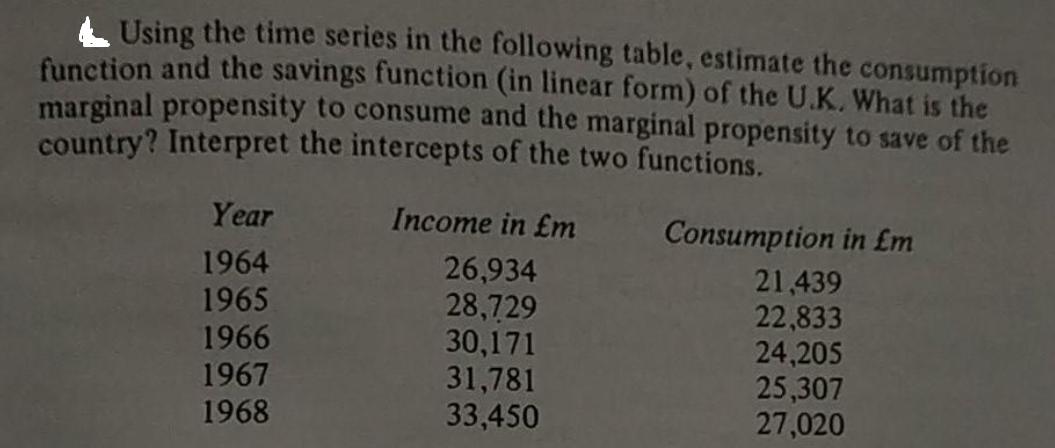
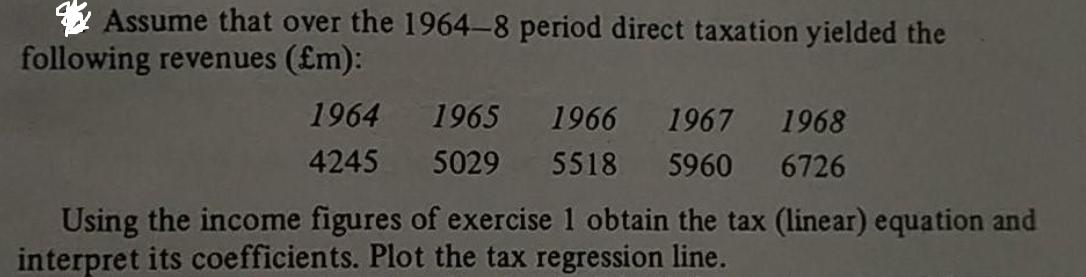
Using the time series in the following table, estimate the consumption function and the savings function (in linear form) of the U.K. What is the marginal propensity to consume and the marginal propensity to save of the country? Interpret the intercepts of the two functions. Year 1964 1965 1966 1967 1968 Income in m 26,934 28,729 30,171 31,781 33,450 Consumption in m 21,439 22,833 24,205 25,307 27,020 Assume that over the 1964-8 period direct taxation yielded the following revenues (m): 1964 4245 1965 1966 1967 1968 5029 5518 5960 6726 Using the income figures of exercise 1 obtain the tax (linear) equation and interpret its coefficients. Plot the tax regression line.
Step by Step Solution
3.40 Rating (156 Votes )
There are 3 Steps involved in it
To estimate the consumption function and the savings function of the UK we need to analyze the relationship between income and consumptionsavings in the given time series data Lets start by calculatin... View full answer

Get step-by-step solutions from verified subject matter experts