

Question: Using the two figures below answer question 2 2. Consider the following profile of potential temperature as a function of height, taken from a GFS
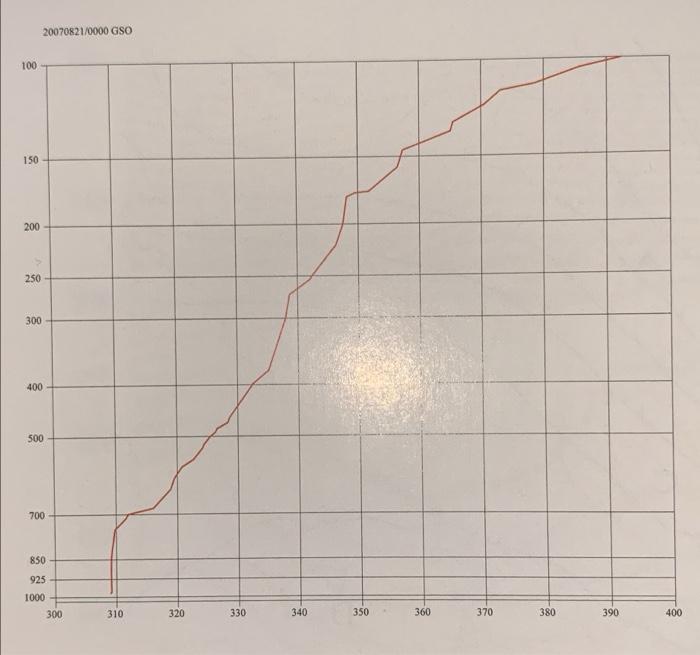
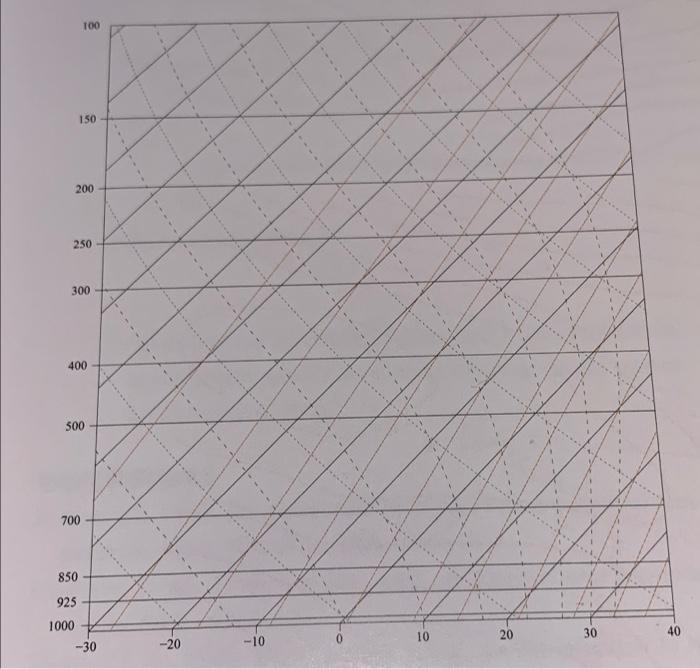
2. Consider the following profile of potential temperature as a function of height, taken from a GFS model fore- cast for Greensboro, NC, valid 1800 UTC 21 Aug 2008. i. On a blank skew T-logp diagram, such as the one provided, sketch the approximate corresponding temperature profile. ii. For this profile, what is the approximate pressure at the mixed layer top? iii. For the same profile, what is the approximate pressure at the tropopause? iv. Explain your reasoning for Gil and ... 2007082110000 GSO 100 150 200 250 300 400 500 700 850 925 1000 300 310 320 330 340 350 360 370 380 390 400 100 150 200 250 300 400 500 700 850 925 1000 -30 40 20 30 10 0 --20 -10
Step by Step Solution
There are 3 Steps involved in it

Get step-by-step solutions from verified subject matter experts