

Question: Using the two sheets above complete them with the given instructions. Direct Marketing Inputs Number of Ads Click Rate 10000 5.00% Parameters Design Fee Cost
Using the two sheets above complete them with the given instructions.
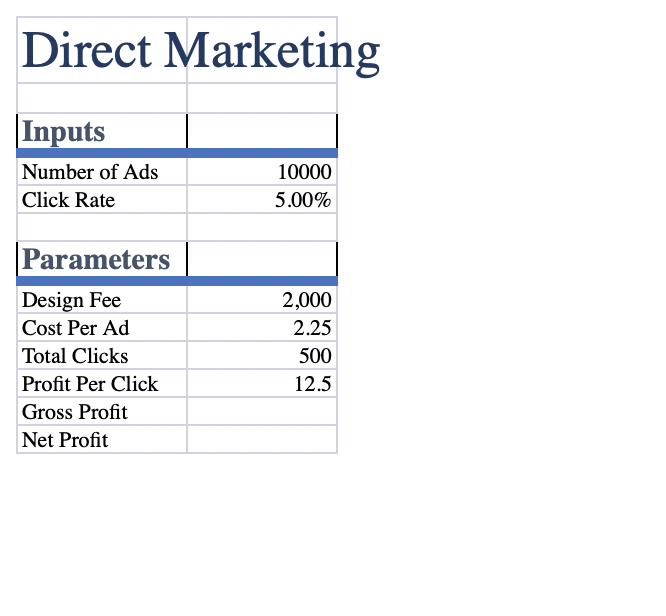
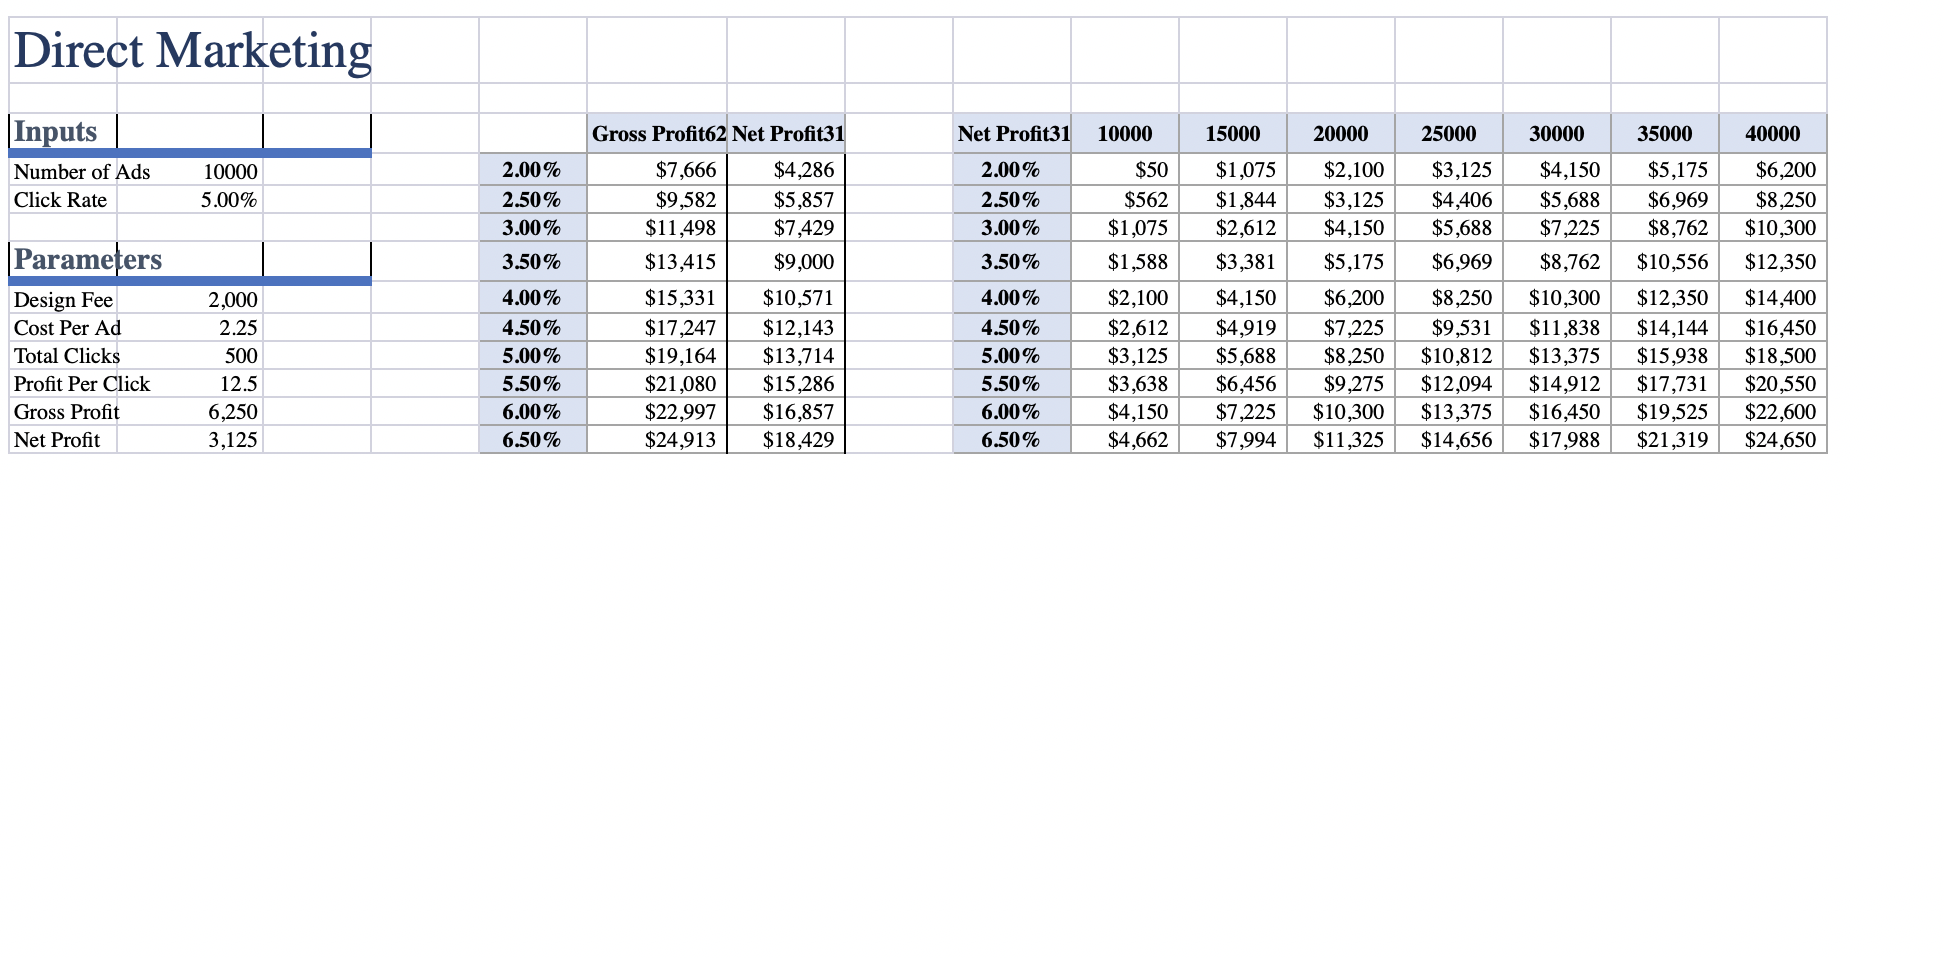
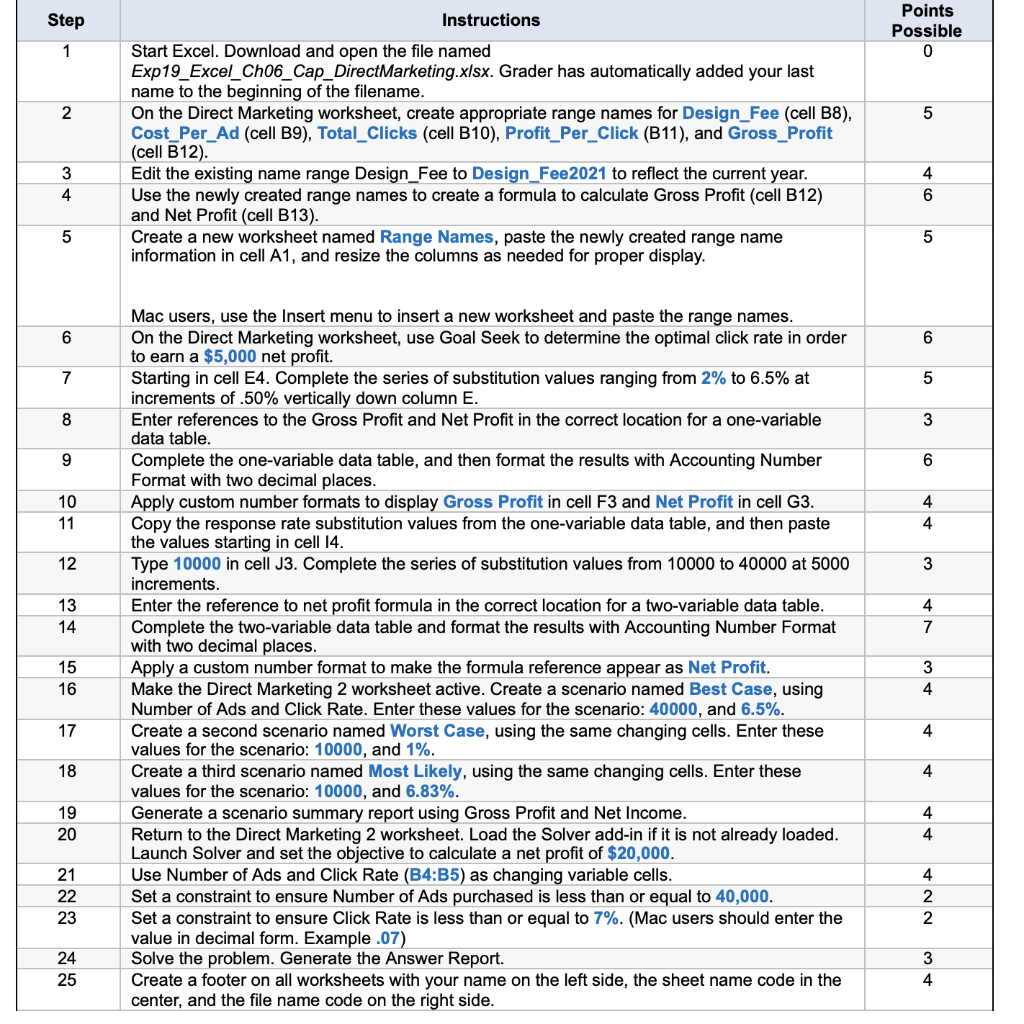
Direct Marketing Inputs Number of Ads Click Rate 10000 5.00% Parameters Design Fee Cost Per Ad Total Clicks Profit Per Click Gross Profit Net Profit 2,000 2.25 500 12.5 Direct Marketing Gross Profit62 Net Profit31 Net Profit31 10000 15000 20000 25000 30000 35000 40000 Inputs Number of Ads Click Rate 10000 5.00% 2.00% 2.50% 3.00% $3,125 $4,406 $5,688 Parameters 3.50% Design Fee Cost Per Ad Total Clicks Profit Per Click Gross Profit Net Profit 2,000 2.25 500 12.5 6,250 3,125 4.00% 4.50% 5.00% 5.50% 6.00% 6.50% $7,666 $9,582 $11,498 $13,415 $15,331 $17,247 $19,164 $21,080 $22,997 $24,913 $4,286 $5,857 $7,429 $9,000 $10,571 $12,143 $13,714 $15,286 $16,857 $18,429 2.00% 2.50% 3.00% 3.50% 4.00% 4.50% 5.00% 5.50% 6.00% 6.50% $50 $562 $1,075 $1,588 $2,100 $2,612 $3,125 $3,638 $4,150 $4,662 $1,075 $1,844 $2,612 $3,381 $4,150 $4,919 $5,688 $6,456 $7,225 $7,994 $2,100 $3,125 $4,150 $5,175 $6,200 $7,225 $8,250 $9,275 $10,300 $11,325 $6,969 $8,250 $9,531 $10,812 $12,094 $13,375 $14,656 $4,150 $5,688 $7,225 $8,762 $10,300 $11,838 $13,375 $14,912 $16,450 $17,988 $5,175 $6,969 $8,762 $10,556 $12,350 $14,144 $15,938 $17,731 $19,525 $21,319 $6,200 $8,250 $10,300 $12,350 $14,400 $16,450 $18,500 $20,550 $22,600 $24,650 Step Instructions Points Possible 0 1 2 5 Start Excel. Download and open the file named Exp19_Excel_Ch06_Cap_DirectMarketing.x/sx. Grader has automatically added your last name to the beginning of the filename. On the Direct Marketing worksheet, create appropriate range names for Design_Fee (cell B8), Cost_Per_Ad (cell B9), Total_Clicks (cell B10), Profit_Per_Click (B11), and Gross_Profit (cell B12). Edit the existing name range Design_Fee to Design_Fee2021 to reflect the current year. Use the newly created range names to create a formula to calculate Gross Profit (cell B12) and Net Profit (cell B13). Create a new worksheet named Range Names, paste the newly created range name information in cell A1, and resize the columns as needed for proper display. 3 4 4 6 5 5 6 6 7 5 8 3 9 6 10 11 4 4 12 3 13 14 4 7 Mac users, use the Insert menu to insert a new worksheet and paste the range names. On the Direct Marketing worksheet, use Goal Seek to determine the optimal click rate in order to earn a $5,000 net profit. Starting in cell E4. Complete the series of substitution values ranging from 2% to 6.5% at increments of .50% vertically down column E. Enter references to the Gross Profit and Net Profit in the correct location for a one-variable data table. Complete the one-variable data table, and then format the results with Accounting Number Format with two decimal places. Apply custom number formats to display Gross Profit in cell F3 and Net Profit in cell G3. Copy the response rate substitution values from the one-variable data table, and then paste the values starting in cell 14. Type 10000 in cell J3. Complete the series of substitution values from 10000 to 40000 at 5000 increments. Enter the reference to net profit formula in the correct location for a two-variable data table. Complete the two-variable data table and format the results with Accounting Number Format with two decimal places. Apply a custom number format to make the formula reference appear as Net Profit. Make the Direct Marketing 2 worksheet active. Create a scenario named Best Case, using Number of Ads and click Rate. Enter these values for the scenario: 40000, and 6.5%. Create a second scenario named Worst Case, using the same changing cells. Enter these values for the scenario: 10000, and 1%. Create a third scenario named Most Likely, using the same changing cells. Enter these values for the scenario: 10000, and 6.83%. Generate a scenario summary report using Gross Profit and Net Income. Return to the Direct Marketing 2 worksheet. Load the Solver add-in if it is not already loaded. Launch Solver and set the objective to calculate a net profit of $20,000. Ads and click Rate (B4:B5) as changing variable Set a constraint to ensure Number of Ads purchased is less than or equal to 40,000. Set a constraint to ensure Click Rate is less than or equal to 7%. (Mac users should enter the value in decimal form. Example .07) Solve the problem. Generate the Answer Report. Create a footer on all worksheets with your name on the left side, the sheet name code in the center, and the file name code on the right side. 15 16 3 4 17 4 18 4 19 20 4 4 21 22 23 4 2 2 24 25 3 4 Direct Marketing Inputs Number of Ads Click Rate 10000 5.00% Parameters Design Fee Cost Per Ad Total Clicks Profit Per Click Gross Profit Net Profit 2,000 2.25 500 12.5 Direct Marketing Gross Profit62 Net Profit31 Net Profit31 10000 15000 20000 25000 30000 35000 40000 Inputs Number of Ads Click Rate 10000 5.00% 2.00% 2.50% 3.00% $3,125 $4,406 $5,688 Parameters 3.50% Design Fee Cost Per Ad Total Clicks Profit Per Click Gross Profit Net Profit 2,000 2.25 500 12.5 6,250 3,125 4.00% 4.50% 5.00% 5.50% 6.00% 6.50% $7,666 $9,582 $11,498 $13,415 $15,331 $17,247 $19,164 $21,080 $22,997 $24,913 $4,286 $5,857 $7,429 $9,000 $10,571 $12,143 $13,714 $15,286 $16,857 $18,429 2.00% 2.50% 3.00% 3.50% 4.00% 4.50% 5.00% 5.50% 6.00% 6.50% $50 $562 $1,075 $1,588 $2,100 $2,612 $3,125 $3,638 $4,150 $4,662 $1,075 $1,844 $2,612 $3,381 $4,150 $4,919 $5,688 $6,456 $7,225 $7,994 $2,100 $3,125 $4,150 $5,175 $6,200 $7,225 $8,250 $9,275 $10,300 $11,325 $6,969 $8,250 $9,531 $10,812 $12,094 $13,375 $14,656 $4,150 $5,688 $7,225 $8,762 $10,300 $11,838 $13,375 $14,912 $16,450 $17,988 $5,175 $6,969 $8,762 $10,556 $12,350 $14,144 $15,938 $17,731 $19,525 $21,319 $6,200 $8,250 $10,300 $12,350 $14,400 $16,450 $18,500 $20,550 $22,600 $24,650 Step Instructions Points Possible 0 1 2 5 Start Excel. Download and open the file named Exp19_Excel_Ch06_Cap_DirectMarketing.x/sx. Grader has automatically added your last name to the beginning of the filename. On the Direct Marketing worksheet, create appropriate range names for Design_Fee (cell B8), Cost_Per_Ad (cell B9), Total_Clicks (cell B10), Profit_Per_Click (B11), and Gross_Profit (cell B12). Edit the existing name range Design_Fee to Design_Fee2021 to reflect the current year. Use the newly created range names to create a formula to calculate Gross Profit (cell B12) and Net Profit (cell B13). Create a new worksheet named Range Names, paste the newly created range name information in cell A1, and resize the columns as needed for proper display. 3 4 4 6 5 5 6 6 7 5 8 3 9 6 10 11 4 4 12 3 13 14 4 7 Mac users, use the Insert menu to insert a new worksheet and paste the range names. On the Direct Marketing worksheet, use Goal Seek to determine the optimal click rate in order to earn a $5,000 net profit. Starting in cell E4. Complete the series of substitution values ranging from 2% to 6.5% at increments of .50% vertically down column E. Enter references to the Gross Profit and Net Profit in the correct location for a one-variable data table. Complete the one-variable data table, and then format the results with Accounting Number Format with two decimal places. Apply custom number formats to display Gross Profit in cell F3 and Net Profit in cell G3. Copy the response rate substitution values from the one-variable data table, and then paste the values starting in cell 14. Type 10000 in cell J3. Complete the series of substitution values from 10000 to 40000 at 5000 increments. Enter the reference to net profit formula in the correct location for a two-variable data table. Complete the two-variable data table and format the results with Accounting Number Format with two decimal places. Apply a custom number format to make the formula reference appear as Net Profit. Make the Direct Marketing 2 worksheet active. Create a scenario named Best Case, using Number of Ads and click Rate. Enter these values for the scenario: 40000, and 6.5%. Create a second scenario named Worst Case, using the same changing cells. Enter these values for the scenario: 10000, and 1%. Create a third scenario named Most Likely, using the same changing cells. Enter these values for the scenario: 10000, and 6.83%. Generate a scenario summary report using Gross Profit and Net Income. Return to the Direct Marketing 2 worksheet. Load the Solver add-in if it is not already loaded. Launch Solver and set the objective to calculate a net profit of $20,000. Ads and click Rate (B4:B5) as changing variable Set a constraint to ensure Number of Ads purchased is less than or equal to 40,000. Set a constraint to ensure Click Rate is less than or equal to 7%. (Mac users should enter the value in decimal form. Example .07) Solve the problem. Generate the Answer Report. Create a footer on all worksheets with your name on the left side, the sheet name code in the center, and the file name code on the right side. 15 16 3 4 17 4 18 4 19 20 4 4 21 22 23 4 2 2 24 25 3 4
Step by Step Solution
There are 3 Steps involved in it

Get step-by-step solutions from verified subject matter experts