

Question: = = Using the two tables below and the text book, verify that y2 = 75.0, , = 88.89, and 73 = 116.67 for sample
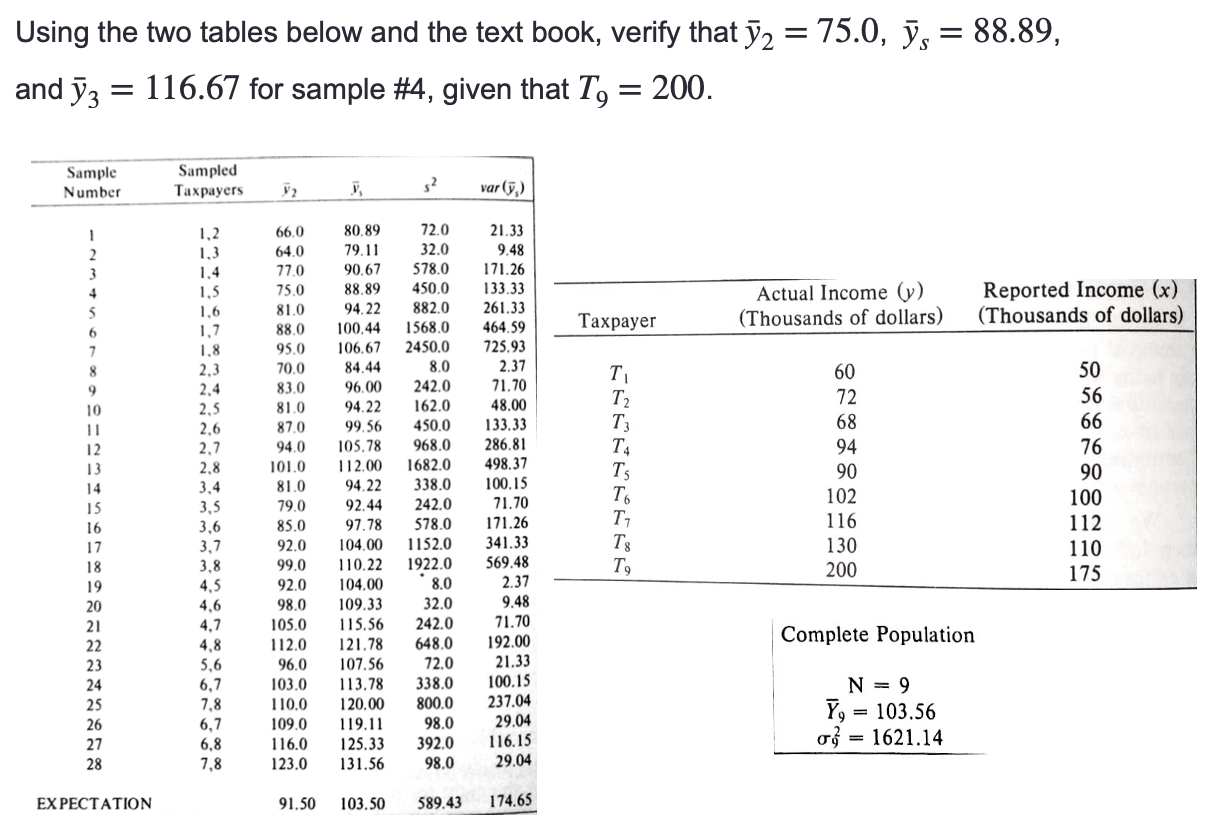
= = Using the two tables below and the text book, verify that y2 = 75.0, , = 88.89, and 73 = 116.67 for sample #4, given that T, = = 200. Sample Number Sampled Taxpayers y, s? var(",) 1 72.0 32.0 4 Actual Income (y) (Thousands of dollars) Reported Income (x) (Thousands of dollars) Taxpayer 6 T2 T3 T4 1.2 1,3 1.4 1,5 1.6 1.7 1.8 2,3 2,4 2.5 2.6 2.7 2.8 3,4 3,5 3.6 3,7 3.8 4,5 4,6 4,7 4,8 5,6 6,7 7,8 6,7 6,8 7,8 66.0 64.0 77.0 75.0 81.0 88.0 95.0 70.0 83.0 81.0 87.0 94.0 101.0 81.0 79.0 85.0 92.0 99.0 92.0 8 9 10 11 12 13 14 15 16 17 18 19 20 21 22 23 24 25 26 27 28 80.89 79.11 90.67 88.89 94.22 100.44 106.67 84.44 96.00 94.22 99.56 105.78 112.00 94.22 92.44 97.78 104.00 110.22 104.00 109.33 115.56 121.78 107.56 113.78 120.00 119.11 125.33 131.56 21.33 9.48 171.26 133.33 261.33 464.59 725.93 2.37 71.70 48.00 133.33 286.81 498.37 100.15 71.70 171.26 341.33 569.48 2.37 9.48 71.70 192.00 21.33 100.15 237.04 29.04 116.15 29.04 578.0 450.0 882.0 1568.0 2450.0 8.0 242.0 162.0 450.0 968.0 1682.0 338.0 242.0 578.0 1152.0 1922.0 8.0 32.0 242.0 648.0 72.0 338.0 800.0 98.0 392.0 98.0 TESSTRESS 60 72 68 94 90 102 116 130 200 T6 50 56 66 76 90 100 112 110 175 T. 98.0 Complete Population 105.0 112.0 96,0 103.0 110.0 109.0 116.0 123.0 N = 9 Y, = = 103.56 of = 1621.14 EXPECTATION 91.50 103.50 589.43 174.65 = = Using the two tables below and the text book, verify that y2 = 75.0, , = 88.89, and 73 = 116.67 for sample #4, given that T, = = 200. Sample Number Sampled Taxpayers y, s? var(",) 1 72.0 32.0 4 Actual Income (y) (Thousands of dollars) Reported Income (x) (Thousands of dollars) Taxpayer 6 T2 T3 T4 1.2 1,3 1.4 1,5 1.6 1.7 1.8 2,3 2,4 2.5 2.6 2.7 2.8 3,4 3,5 3.6 3,7 3.8 4,5 4,6 4,7 4,8 5,6 6,7 7,8 6,7 6,8 7,8 66.0 64.0 77.0 75.0 81.0 88.0 95.0 70.0 83.0 81.0 87.0 94.0 101.0 81.0 79.0 85.0 92.0 99.0 92.0 8 9 10 11 12 13 14 15 16 17 18 19 20 21 22 23 24 25 26 27 28 80.89 79.11 90.67 88.89 94.22 100.44 106.67 84.44 96.00 94.22 99.56 105.78 112.00 94.22 92.44 97.78 104.00 110.22 104.00 109.33 115.56 121.78 107.56 113.78 120.00 119.11 125.33 131.56 21.33 9.48 171.26 133.33 261.33 464.59 725.93 2.37 71.70 48.00 133.33 286.81 498.37 100.15 71.70 171.26 341.33 569.48 2.37 9.48 71.70 192.00 21.33 100.15 237.04 29.04 116.15 29.04 578.0 450.0 882.0 1568.0 2450.0 8.0 242.0 162.0 450.0 968.0 1682.0 338.0 242.0 578.0 1152.0 1922.0 8.0 32.0 242.0 648.0 72.0 338.0 800.0 98.0 392.0 98.0 TESSTRESS 60 72 68 94 90 102 116 130 200 T6 50 56 66 76 90 100 112 110 175 T. 98.0 Complete Population 105.0 112.0 96,0 103.0 110.0 109.0 116.0 123.0 N = 9 Y, = = 103.56 of = 1621.14 EXPECTATION 91.50 103.50 589.43 174.65
Step by Step Solution
There are 3 Steps involved in it

Get step-by-step solutions from verified subject matter experts