

Question: Using the WACC obtained from in Step (4) as the discount rate for this project, apply capital budgeting analysis techniques (NPV, IRR, MIRR, PI, Payback,
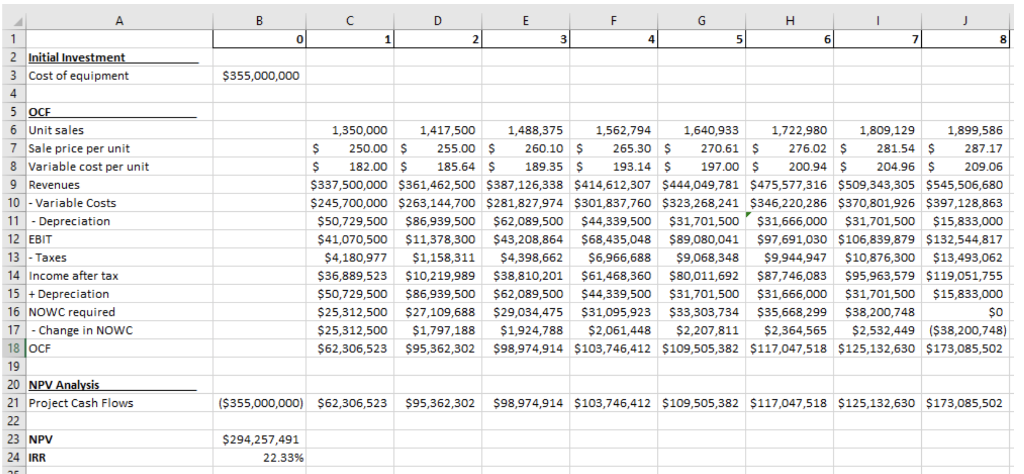
 Using the WACC obtained from in Step (4) as the discount rate for this project, apply capital budgeting analysis techniques (NPV, IRR, MIRR, PI, Payback, Discounted Payback) to analyze the new project.
WACC is 6.54%
Corporate Tax is 10.18%
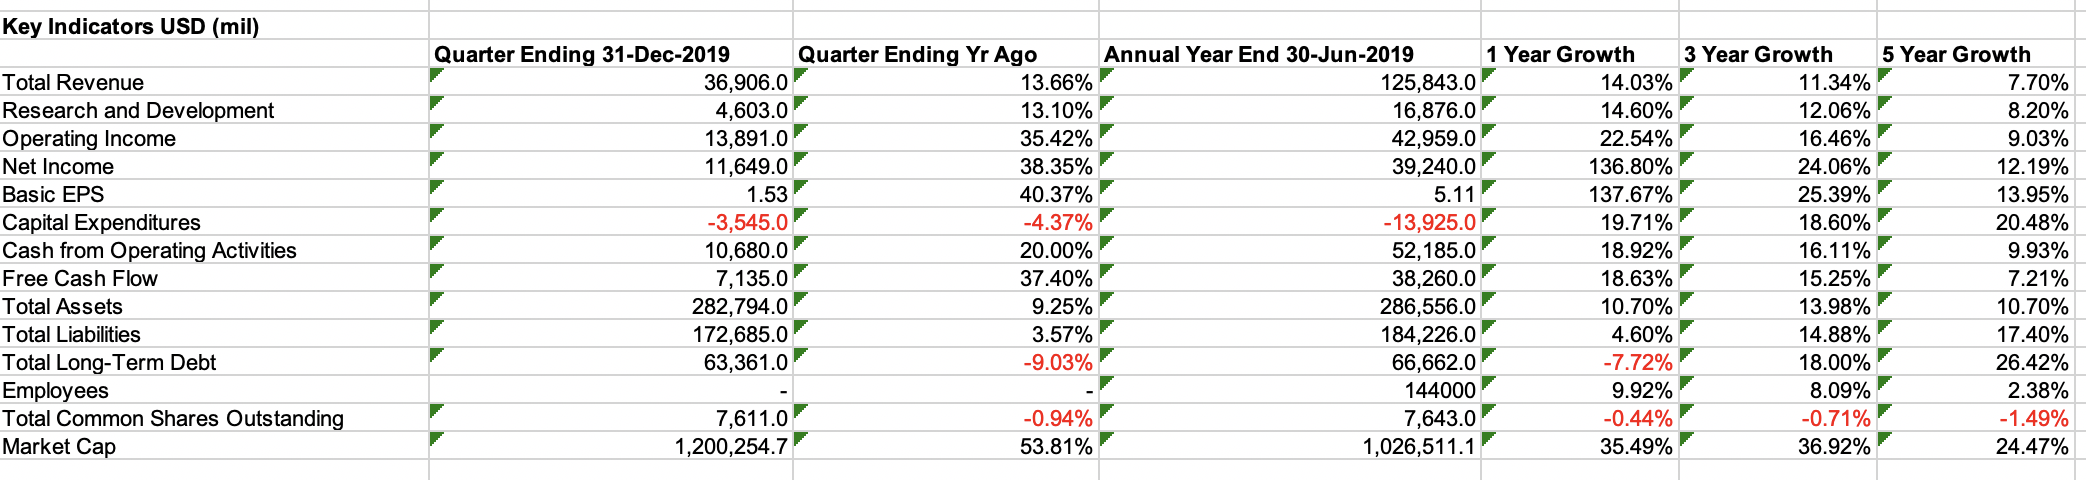
B D E F G H 1 J 01 1 21 3 4 5 6 8 $355,000,000 2 Initial Investment 3 Cost of equipment 4 5 OCE 6 Unit sales 7 Sale price per unit 8 Variable cost per unit 9 Revenues 10 - Variable Costs 11 - Depreciation 12 EBIT 13 - Taxes 14 Income after tax 15 + Depreciation 16 NOWC required 17 - Change in NOWC 18 JOCF 19 20 NPV Analysis 21 Project Cash Flows 22 23 NPV 24 IRR 1,350,000 1,417,500 1,488,375 1,562,794 1,640,933 1,722,980 1,809,129 1,899,586 $ 250.00 $ 255.00 $ 260.10 $ 265.30 $ 270.61 $ 276.02 $ 281.54 $ 287.17 $ 182.00 $ 185.64 $ 189.35 $ 193.14 $ 197.00 $ 200.94 $ 204.96 $ 209.06 $337,500,000 $361,462,500 $387,126,338 $414,612,307 $444,049,781 $475,577,316 $509,343,305 $545,506,680 $245,700,000 $263,144,700 $281,827,974 $301,837,760 $323,268,241 $346,220,286 $370,801,926 $397,128,863 $50,729,500 $86,939,500 $62,089,500 $44,339,500 $31,701,500 $31,666,000 $31,701,500 $15,833,000 $41,070,500 $11,378,300 $43,208,864 $68,435,048 $89,080,041 $97,691,030 $106,839,879 $132,544,817 $4,180,977 $1,158,311 $4,398,662 $6,966,688 $9,068,348 $9,944,947 $10,876,300 $13,493,062 $36,889,523 $10,219,989 $38,810,201 $61,468,360 $80,011,692 $87,746,083 $95,963,579 $119,051,755 $50,729,500 $86,939,500 $62,089,500 $62,089,500 $44,339,500 $31,701,500 $31,666,000 $31,701,500 $15,833,000 $25,312,500 $27,109,688 $29,034,475 $31,095,923 $33,303,734 $35,668,299 $38,200,748 $0 $25,312,500 $1,797,188 $1,924,788 $2,061,448 $2,207,811 $2,364,565 $2,532,449 ($38,200,748) $62,306,523 $95,362,302 $98,974,914 $103,746,412 $109,505,382 $117,047,518 $125,132,630 $173,085,502 ($355,000,000) $62,306,523 $95,362,302 $98,974,914 $103,746,412 $109,505,382 $117,047,518 $125,132,630 $173,085,502 $294,257,491 22.33% Key Indicators USD (mil) Total Revenue Research and Development Operating Income Net Income Basic EPS Capital Expenditures Cash from Operating Activities Free Cash Flow Total Assets Total Liabilities Total Long-Term Debt Employees Total Common Shares Outstanding Market Cap Quarter Ending 31-Dec-2019 36,906.0 4,603.0 13,891.0 11,649.0 1.53 -3,545.0 10,680.0 7,135.0 282,794.0 172,685.0 63,361.0 Quarter Ending Yr Ago 13.66% 13.10% 35.42% 38.35% 40.37% -4.37% 20.00% 37.40% 9.25% 3.57% -9.03% Annual Year End 30-Jun-2019 125,843.0 16,876.0 42,959.0 39,240.0 5.11 -13,925.0 52,185.0 38,260.0 286,556.0 184,226.0 66,662.0 144000 7,643.0 1,026,511.1 1 Year Growth 14.03% 14.60% 22.54% 136.80% 137.67% 19.71% 18.92% 18.63% 10.70% 4.60% -7.72% 9.92% -0.44% 35.49% 3 Year Growth 11.34% 12.06% 16.46% 24.06% 25.39% 18.60% 16.11% 15.25% 13.98% 14.88% 18.00% 8.09% -0.71% 36.92% 5 Year Growth 7.70% 8.20% 9.03% 12.19% 13.95% 20.48% 9.93% 7.21% 10.70% 17.40% 26.42% 2.38% -1.49% 24.47% 7,611.0 1,200,254.7 -0.94% 53.81%
Step by Step Solution
There are 3 Steps involved in it

Get step-by-step solutions from verified subject matter experts