

Question: Using the waste data given in the Table below and with the information on local conditions as outlined below, estimate the total weekly mass (
Using the waste data given in the Table below and with the information on local conditions
as outlined below, estimate the total weekly mass tonnes and volume m of waste typically generated by
a community of the size of the City of ABC population Exclude industrial waste as it is handled
and disposed of by the industries themselves. Account for hazardous waste separately. Assume the
following:
Residential and commercial wastes are cocollected by the municipal collection system, with the recyclables
collected in a separate stream
Institutional wastes are collected separately and disposed of at the transfer station
Construction and demolition waste collected separately and disposed of at transfer station
Hazardous waste separation is encouraged with a free drop off site managed by the City
Special wastes are accepted at the transfer station
Due to composting, municipal service wastes disposed of directly at transfer station, not incorporated into
total mass
Assume the following uncompacted waste densities for waste stream described above:
Residential and Commercial
Paper and cardboard @: kgm
Glass @ : kgm
Metal @ : kg m
Plastic @ : kgm
Rest: kgm
Special: kgm
Institutional: kgm
Construction and demolition: kgm
BITS Pilani, Pilani Campus
CE F Introduction to Environmental Engineering
Solid Waste Management
Numerical : Municipal services
Street cleaning: kgm
Landscaping: kgm
Parks: kgm
Catch basins: kgm
Sludge: kgm
HW: kgmassume mostly liquid
How many garbage truck trips are made each week to the transfer station for the
residential and commercial waste? Recyclables and rest are handled in separate
vehicles. Assume a typical compactor has a volume of m at a density of
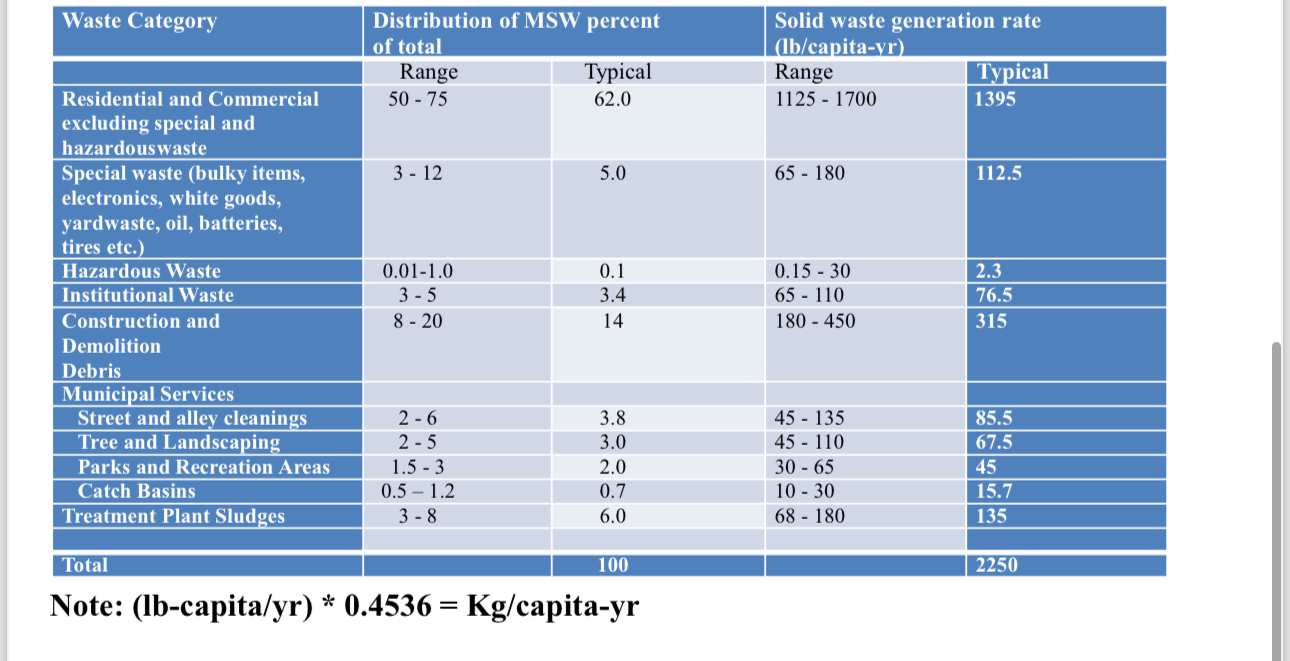
kgmtableWaste Category,tableDistribution of MSW percentof totaltableSolid waste generation ratelbcapitayrRangeTypical,Range,TypicaltableResidential and Commercialexcluding special andhazardouswastetableSpecial waste bulky items,electronics white goods,yardwaste oil, batteries,tires etc.Hazardous Waste,Institutional Waste,tableConstruction andDemolitionDebrisMunicipal ServicesStreet and alley cleanings,Tree and Landscaping,Parks and Recreation Areas,bar Catch Basins,Treatment Plant Sludges,Total
Note: lbcapitayr capitayr
Step by Step Solution
There are 3 Steps involved in it
1 Expert Approved Answer
Step: 1 Unlock

Question Has Been Solved by an Expert!
Get step-by-step solutions from verified subject matter experts
Step: 2 Unlock
Step: 3 Unlock