

Question: Using theDemo Datafile, a chart Will be created that represents the number of fruit eaten per month for each fruit. This should be one (1)
- Using theDemo Datafile, a chart Will be created that represents the number of fruit eaten per month for each fruit. This should be one (1) chart for all fruit.
- Calculate the appropriate measure(s) of central tendency for fruit eaten per month. Sum the total fruit per month eaten. (Hint: Measures of central tendency are applied according to the level of measurement - fruit would be a _______ variable)
- Copy the chart, and paste into a Word document as an Excel object.
- a table of the chart in the document that includes the Total fruit eaten, as well as the applicable measure(s) of central tendency. Note: the table should include the names of the(each) measure in conjunction with the calculation.
- Describe the data: What is the data about?
- Explain why the chart type you selected is most appropriate for the representation of this data.
- Explain your measure(s) of central tendency and what they say about the data.
- Interpret the data: What does the chart show you? What fruit stands out to you and why?
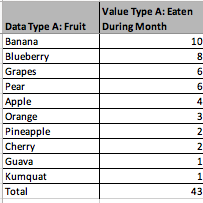
Value Type A: Eaten Data Type A: Fruit During Month Banana 10 Blueberry Grapes Pear Apple A Orange 3 Pineapple 2 Cherry 2 Guava 1 Kumquat 1 Total 43
Step by Step Solution
There are 3 Steps involved in it
1 Expert Approved Answer
Step: 1 Unlock

Question Has Been Solved by an Expert!
Get step-by-step solutions from verified subject matter experts
Step: 2 Unlock
Step: 3 Unlock