

Question: Using these charts below Compare and Contrast each statistic across the country categories. Argentina Life expectancy - 76.59 years HALE - 54.26 years Birth and
Using these charts below Compare and Contrast each statistic across the country categories.
Argentina
Life expectancy - 76.59 years HALE - 54.26 years Birth and cause of death registration coverage - Birth 83%, Death 72% Under-five mortality rate - 9.9 deaths per 1000 live birth maternal mortality ratio - 39 deaths per 10000 live birth
Spain
Life expectancy - 83.49 years HALE - 73. 8 years Birth and cause of death registration coverage - Birth 96.1%, Death 89% Under-five mortality rate - 3 deaths per 1000 live birth maternal mortality ratio - 4 deaths per 10000 live birth
Korea
Life expectancy - 82.92 years HALE - 72.2 years Birth and cause of death registration coverage - Birth 96.9%, Death 92% Under-five mortality rate - 3.2 deaths per 1000 live birth maternal mortality ratio - 11 deaths per 1000

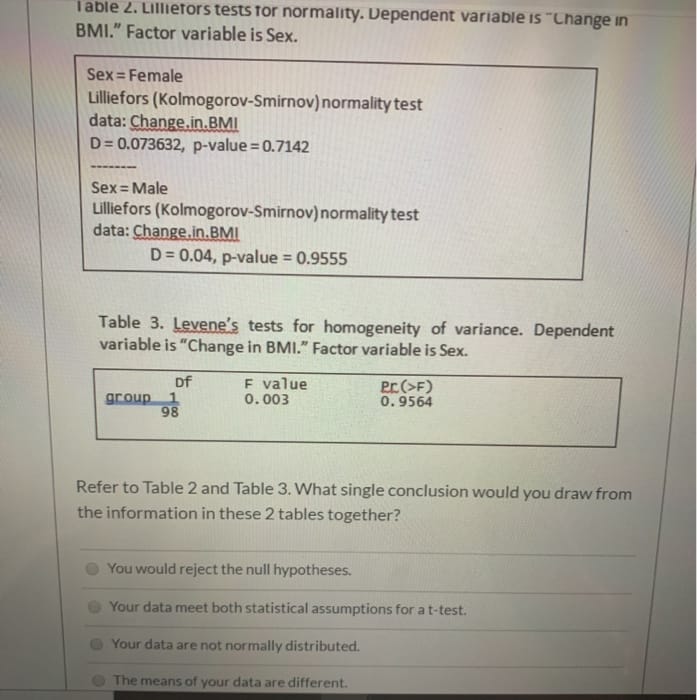

1. Consider the Markov chain with the following transition matrix. 0 0.5 0.5 0.5 0 0.5 0.5 0.5 0 (a) Draw the transition diagram of the Markov chain. (b) Is the Markov chain ergodic? Give a reason for your answer. (c) Compute the two step transition matrix of the Markov chain. (d) What is the state distribution *, for t = 2 if the initial state distribution for t = 0 is no = (0.1, 0.5, 0.4) T?I able 2. Lillietors tests for normality. Dependent variable is "Change in BMI." Factor variable is Sex. Sex = Female Lilliefors (Kolmogorov-Smirnov) normality test data: Change.in.BMI D= 0.073632, p-value =0.7142 Sex = Male Lilliefors (Kolmogorov-Smirnov) normality test data: Change,in.BMI D = 0.04, p-value = 0.9555 Table 3. Levene's tests for homogeneity of variance. Dependent variable is "Change in BMI." Factor variable is Sex. DF F value PC(>F) group 0. 003 0. 9564 98 Refer to Table 2 and Table 3. What single conclusion would you draw from the information in these 2 tables together? You would reject the null hypotheses. Your data meet both statistical assumptions for a t-test. Your data are not normally distributed. The means of your data are different.Find the transition matrix from B to B', the transition matrix from B' to B, verify that coordinate matrix [x]8. B = {(-2, 1), (1, -1)}, B' = {(0, 2), (1, 1)), [x]s = 8 -4 (a) Find the transition matrix from B to B'. p-1 (b) Find the transition matrix from B' to B. P = (c) Verify that the two transition matrices are inverses of each other. pp-1 = (d) Find the coordinate matrix [x]s', given the coordinate matrix [x]g. [x]8=
Step by Step Solution
There are 3 Steps involved in it

Get step-by-step solutions from verified subject matter experts