

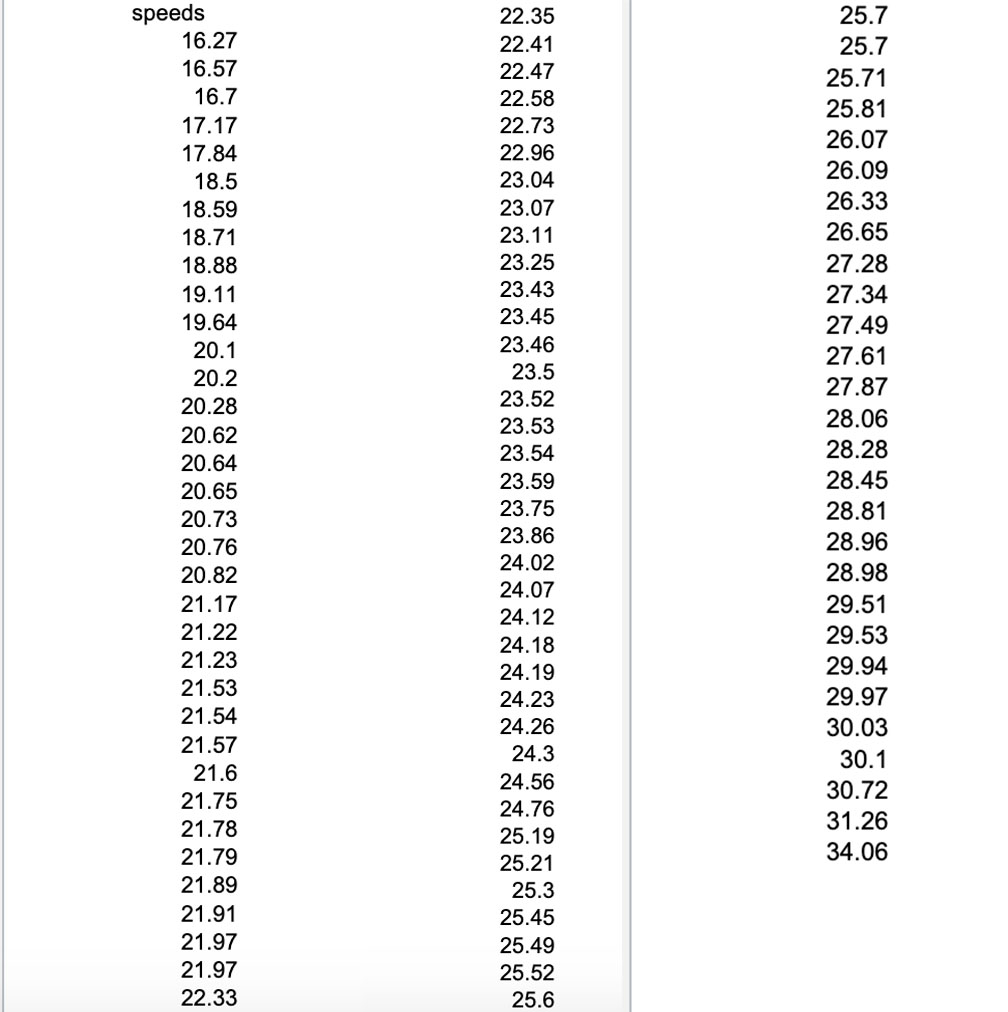
Question: Using this 3-column set of numbers, please present these values in a normal probability (quantile) plot with n scores on the x-axis and speed on

Using this 3-column set of numbers, please present these values in a normal probability (quantile) plot with n scores on the x-axis and speed on the y axis: I will attach the numbers in a jpeg.
Step by Step Solution
There are 3 Steps involved in it
1 Expert Approved Answer
Step: 1 Unlock

Question Has Been Solved by an Expert!
Get step-by-step solutions from verified subject matter experts
Step: 2 Unlock
Step: 3 Unlock