

Question: Using this as the starting data please let me know how to calculate the following in excel. I know not all 10 years is here
Using this as the starting data please let me know how to calculate the following in excel. I know not all 10 years is here because I can't attach the entire excel file so please just use what is provided.
find the daily stock returns over a 10 year span and statistical properties such as means, median, and mode, standard deviation, skewness and kurtosis (higher order moments)
Open the data file in Excel to compute returns as follows: Either as (Pt - Pt-1)/Pt-1 or as Ln(Pt/Pt-1) Keep in mind the returns for date t are shown as above and not any other combination.
Use statistical functions in Excel to compile statistical properties.
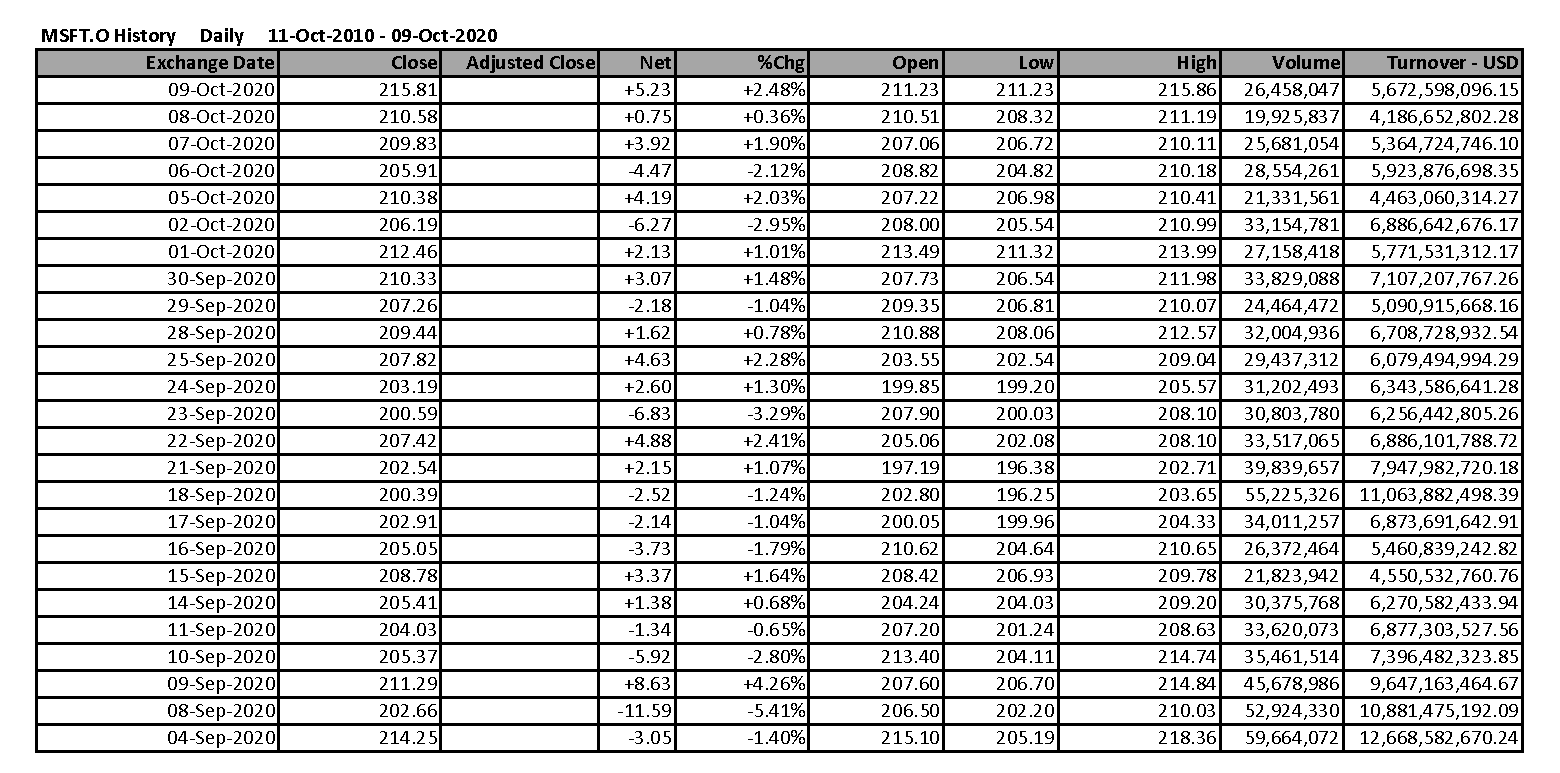
Open 211.23 210.51 207.06 208.82 Low 211.23 208.32 206.72 204.82 207.22 208.00 213.49 207.73 209.35 MSFT.O History Daily 11-Oct-2010-09-Oct-2020 Exchange Date Close Adjusted Close 09-Oct-2020 215.81 08-Oct-2020 210.58 07-Oct-2020 209.83 06-Oct-2020 205.91 05-Oct-2020 210.38 02-Oct-2020 206.19 01-Oct-2020 212.46 30-Sep-2020 210.33 29-Sep-2020 207.26 28-Sep-2020 209.44 25-Sep-2020 207.82 24-Sep-2020 203.19 23-Sep-2020 200.59 22-Sep-2020 207.42 21-Sep-2020 202.54 18-Sep-2020 200.39 17-Sep-2020 202.91 16-Sep-2020 205.05 15-Sep-2020 208.78 14-Sep-20201 205.41 11-Sep-20201 204.03 10-Sep-2020 205.37 09-Sep-2020 211.29 08-Sep-2020 202.661 04-Sep-2020 214.251 Net +5.23 +0.75 +3.92 4.47 +4.19 -6.27 +2.13 +3.07 -2.18 +1.62 +4.63 +2.60 -6.83 +4.88 +2.15 -2.52 -2.14 -3.73 +3.37 %Chg +2.48% +0.36% +1.90% -2.12% +2.03% -2.95% +1.01% +1.48% -1.04% +0.78% +2.28% +1.30% 3.29% +2.41% +1.07% -1.24% -1.04% -1.79% +1.64% +0.68% -0.65% -2.80% +4.26% -5.41% -1.40% 210.88 203.55 199.85 207.90 205.06 197.19 202.80 200.05 210.62 208.42 204.24 207.20 213.40 207.60 206.50 215.10 206.98 205.54 211.32 206.54 206.81 208.06 202.54 199.20 200.03 202.08 196.38 196.25 199.96 204.64 206.93 204.03 201.24 204.11 206.70 202.20 205.19 High 215.86 211.19 210.11 210.18 210.41 210.99 213.99 211.98 210.07 212.57 209.04 205.57 208.10 208.10 202.71 203.65 204.33 210.65 209.78 209.20 208.63 214.74 214.84 210.03 218.36 Volume Turnover - USD 26,458,047 5,672,598,096.15 19,925,837 4,186,652,802.28 25,681,054 5,364,724,746.10 28,554,261 5,923,876,698.35 21,331,561 4,463,060,314.27 33,154,781 6,886,642,676.17 27,158,418 5,771,531,312.17 33,829,088 7,107,207,767.26 24,464,472 5,090,915,668.16 32,004,936 6,708,728,932.54 29,437,312 6,079,494,994.29 31,202,493 6,343,586,641.28 30,803,780 6,256,442,805.26 33,517,065 6,886,101,788.72 39,839,657 7,947,982,720.18 55,225,326 11,063,882,498.39 34,011,257 6,873,691,642.91 26,372,464 5,460,839,242.82 21,823,942 4,550,532,760.76 30,375,768 6,270,582,433.94 33,620,073 6,877,303,527.56 35,461,514 7,396,482,323.85 45,678,986 9,647,163,464.67 52,924,330 10,881,475,192.09 59,664,072 12,668,582,670.24 +1.38 -1.34 -5.92 +8.63 -11.59 -3.05 Open 211.23 210.51 207.06 208.82 Low 211.23 208.32 206.72 204.82 207.22 208.00 213.49 207.73 209.35 MSFT.O History Daily 11-Oct-2010-09-Oct-2020 Exchange Date Close Adjusted Close 09-Oct-2020 215.81 08-Oct-2020 210.58 07-Oct-2020 209.83 06-Oct-2020 205.91 05-Oct-2020 210.38 02-Oct-2020 206.19 01-Oct-2020 212.46 30-Sep-2020 210.33 29-Sep-2020 207.26 28-Sep-2020 209.44 25-Sep-2020 207.82 24-Sep-2020 203.19 23-Sep-2020 200.59 22-Sep-2020 207.42 21-Sep-2020 202.54 18-Sep-2020 200.39 17-Sep-2020 202.91 16-Sep-2020 205.05 15-Sep-2020 208.78 14-Sep-20201 205.41 11-Sep-20201 204.03 10-Sep-2020 205.37 09-Sep-2020 211.29 08-Sep-2020 202.661 04-Sep-2020 214.251 Net +5.23 +0.75 +3.92 4.47 +4.19 -6.27 +2.13 +3.07 -2.18 +1.62 +4.63 +2.60 -6.83 +4.88 +2.15 -2.52 -2.14 -3.73 +3.37 %Chg +2.48% +0.36% +1.90% -2.12% +2.03% -2.95% +1.01% +1.48% -1.04% +0.78% +2.28% +1.30% 3.29% +2.41% +1.07% -1.24% -1.04% -1.79% +1.64% +0.68% -0.65% -2.80% +4.26% -5.41% -1.40% 210.88 203.55 199.85 207.90 205.06 197.19 202.80 200.05 210.62 208.42 204.24 207.20 213.40 207.60 206.50 215.10 206.98 205.54 211.32 206.54 206.81 208.06 202.54 199.20 200.03 202.08 196.38 196.25 199.96 204.64 206.93 204.03 201.24 204.11 206.70 202.20 205.19 High 215.86 211.19 210.11 210.18 210.41 210.99 213.99 211.98 210.07 212.57 209.04 205.57 208.10 208.10 202.71 203.65 204.33 210.65 209.78 209.20 208.63 214.74 214.84 210.03 218.36 Volume Turnover - USD 26,458,047 5,672,598,096.15 19,925,837 4,186,652,802.28 25,681,054 5,364,724,746.10 28,554,261 5,923,876,698.35 21,331,561 4,463,060,314.27 33,154,781 6,886,642,676.17 27,158,418 5,771,531,312.17 33,829,088 7,107,207,767.26 24,464,472 5,090,915,668.16 32,004,936 6,708,728,932.54 29,437,312 6,079,494,994.29 31,202,493 6,343,586,641.28 30,803,780 6,256,442,805.26 33,517,065 6,886,101,788.72 39,839,657 7,947,982,720.18 55,225,326 11,063,882,498.39 34,011,257 6,873,691,642.91 26,372,464 5,460,839,242.82 21,823,942 4,550,532,760.76 30,375,768 6,270,582,433.94 33,620,073 6,877,303,527.56 35,461,514 7,396,482,323.85 45,678,986 9,647,163,464.67 52,924,330 10,881,475,192.09 59,664,072 12,668,582,670.24 +1.38 -1.34 -5.92 +8.63 -11.59 -3.05
Step by Step Solution
There are 3 Steps involved in it

Get step-by-step solutions from verified subject matter experts