

Question: Using this data, address a few important questions below; 1. (1 point) Create new data sat.df by adding subjective measures of satisfaction. 2. (4 points)

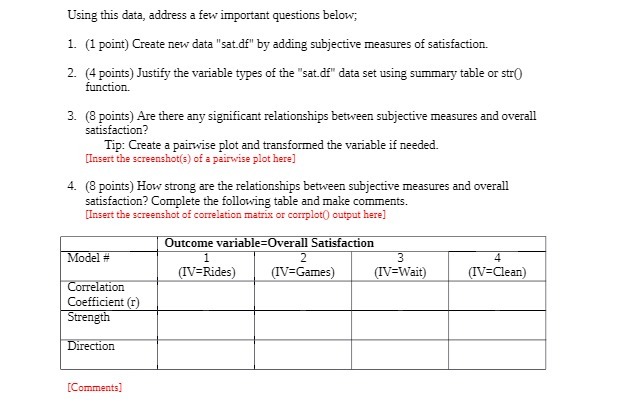
Using this data, address a few important questions below; 1. (1 point) Create new data "sat.df" by adding subjective measures of satisfaction. 2. (4 points) Justify the variable types of the "sat.df" data set using summary table or str() function. 3. (8 points) Are there any significant relationships between subjective measures and overall satisfaction? Tip: Create a pairwise plot and transformed the variable if needed. [Insert the screenshot(s) of a pairwise plot here] 4. (8 points) How strong are the relationships between subjective measures and overall satisfaction? Complete the following table and make comments. [Insert the screenshot of correlation matrix or complot () output here] Outcome variable=Overall Satisfaction Model # 2 3 4 (IV=Rides) (IV=Games) (IV=Wait] (IV=Clean) Correlation Coefficient (r) Strength Direction [Comments]
Step by Step Solution
There are 3 Steps involved in it

Get step-by-step solutions from verified subject matter experts