

Question: Using this data, calculate cost of debt. Please show work. %2F603640%2Fitems%2FU0010-PDF-ENG%2Fcontent&metadata :e30%3D UV0010 Exhibit 1 Nike, Inc.: Cost of Capital Consolidated Income Statements Year Ended
 Using this data, calculate cost of debt. Please show work.
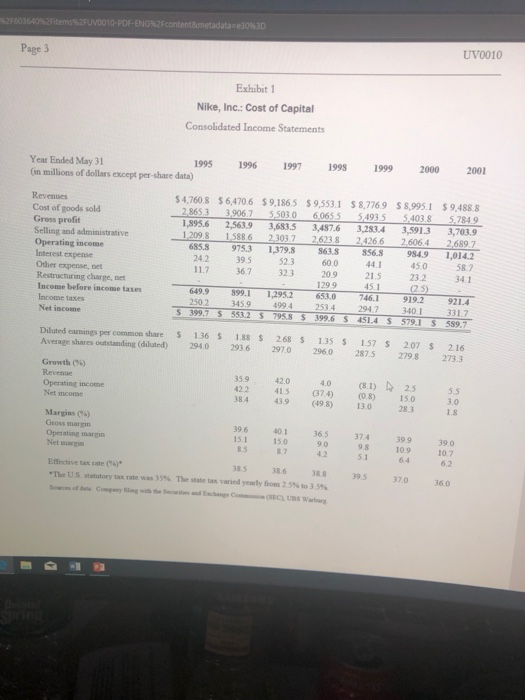
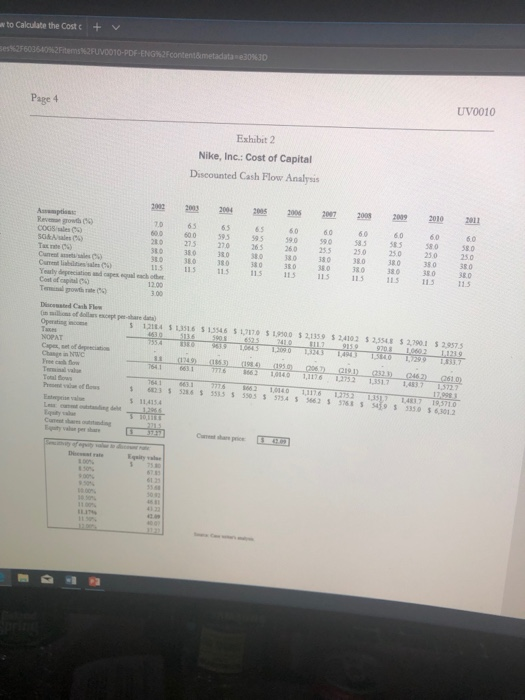
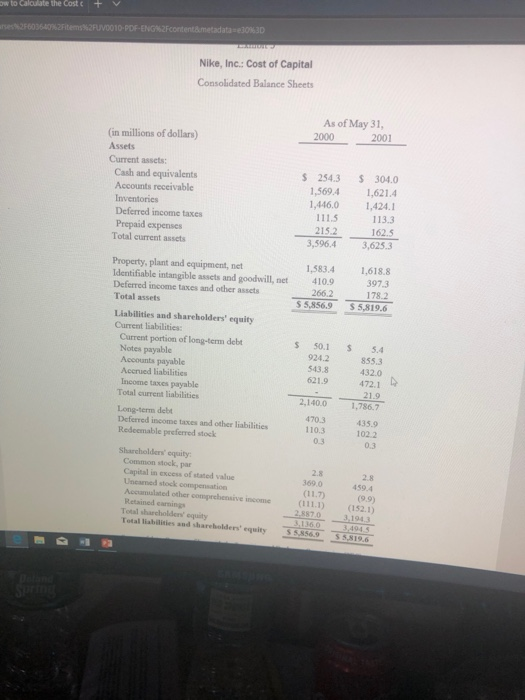
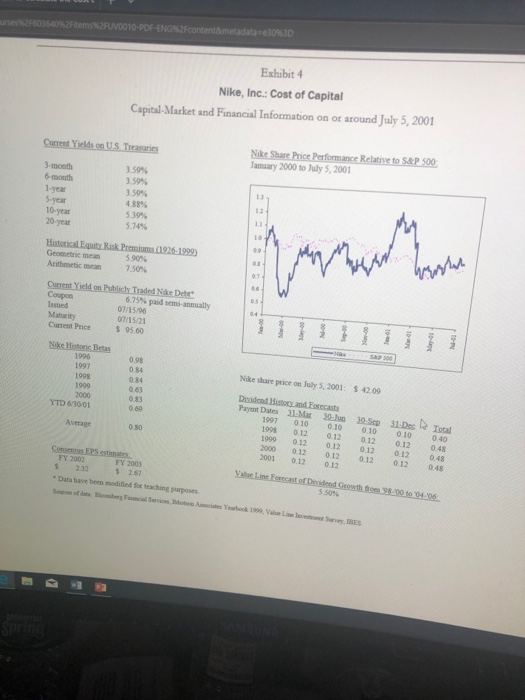
 %2F603640%2Fitems%2FU0010-PDF-ENG%2Fcontent&metadata :e30%3D UV0010 Exhibit 1 Nike, Inc.: Cost of Capital Consolidated Income Statements Year Ended May 31 1995 1996 1997 199 999 2000 2001 in millions of dollars except per-share data) Revenues Cost of goods sold Gress profit Selling and administrative Operating income 4,7608 $6,4706 $ 9,1865 $9,553.1 $8,7769 8,9951 $9,488.8 2865 3 39067 55030 60655 5,4935 5403.8 5.7849 1,895.6 2,563.9 3,683.5 3,487.6 3,283.4 3,591.3 3,703.9 1.2098 15886 23037 26238 24266 26064 26897 685.3 975.3 1379.8 863.8 856.8 984.9 1,014.2 52.3 600 44.1 Interest expense 24.2 39.5 45.0 58.7 11.7 36.7 323 20.9 21.S 23.2 341 Other expense, net Restructuring charge, net Income before incotse taxes Net income 1299 6499 899.1 1,295.2 653.0 746.1 399 919.2 2502 3459 4994 2534 294.7 340.1 399.6 S 451.4 $ 579.1 921.4 331.7 589.7 S 399.7 $ 553.2 $ 7958 Diluted carnings per commoe share $ 136 188 268 1.35 157 S 207 S 2.16 Average shares outstanding (diluted) 2940 293.6 297.0 2960 287.5 2798 273.3 Growth(%) Revenue Operating income Net income 359 420 40 (81) 25 422 415 (374) (08) 15.0 384 43.9 49.8) 13.0 5.5 3.0 1.8 28.3 Margins (%) Gross margin Operating margin Net g 96 401 365 37439939 151 15.0 8587 9.0 4.2 98 5.1 109 6.4 10.7 6 2 Effective tax rate (96) "The US statutory tax rate wn 35% 385 386 38839.5370 360 The state tax varied yearly fiom 25% to 3.5%. w to Calculate the Cost c+V es%2F60360i%2Fitems%2FUV0010-PDF-ENG%2F content&metadata "e30%30 UV0010 Page 4 Exhibit 2 Nike, Inc.: Cost of Capital Discounted Cash Flow Analysis Reven-groda CS) costales (%) so&Males (%) Tax nte 04) 70 65 6 6060 6606060 600 600 595 195 90 590 sa.I SES SO 55.0 20 275 380 380 310 380 380 380 380 3,0 38 O 380 0 380 30 80 3003038030 380 270 265 260 255 250 250 20 25.0 Current liabili es sales (%) Yeauly depeeciation and capes eqgual each othe Costafeapiu (%) 12.00 3.00 Disconsted Canh Flo Operating inc 1,214 $ 1,151.6 S 1334 6 $1,717.0 % 1950.0 $ 2,135.9 $2,410.2 $2,554,E S2,790.1 S3573 $ NOPAT Capes, set of depeciation Change in NWC Free cah flow 661 1 666.2 1,0140 1,4837 1,372 536 33353 3305734 56 s6823 5 528.6 3535 5 5503 5734 5 576 49 33 6,3012 % 11.4154 61 23 30.50% owtoCalculate the Cost C ata-e30%3D rses%2F603640%2Fitems%2RV00 10-POF-ENG%2Fcortentanetad Nike, Inc.: Cost of Capital Consolidated Balance Sheets As of May 31 2000200 (in millions of dollars) Assets Current assets: s 254.3 304.0 1,569.4 1,621.4 1,446.01,424.1 113.3 162.5 3,596.4 3,623.3 Cash and equivalents Accounts receivable 1115 Deferred income taxes Prepaid expenses Total current assets Property, plant and equipment, net Identifiable intangible assets and goodwill, net Deferred income taxes and other assets Total assets 1,583.41,618.8 397.3 178.2 S 5,856.9 $5,819.6 410.9 266.2 17 Liabilities and shareholders' equity Current liabilities Current portion of long-term debt s s0.1 S 5.4 Notes payable Accounts payable Acerued liabilities Income taxes payable Total current liabilities 924.2 543.8 621.9 855.3 432.0 472.1 ? Long-term debt Deferred income taxes and other liabilities Redeemable preferred stock 2,140.0 1786R 4703 435.9 102.2 0.3 110.3 0.3 Sharcholders equity Common stock, par Capital in excess of stated value Uncamed stock compensation 2.8 369.0 2.8 459.4 (9.9) (111.) (152.1) 3,194.3 Retained ecarnings Total sharcholders' equity Total liabilisties and shareholders' equity 5856.9 35,819.6 Smetadata e30%30 3640%2Fitems%2FUV00 10-PDF-E Exhibit 4 Nike, Inc.: Cost of Capital Capital-Market and Financial Information on or around July 5, 2001 anuary 2000 to July 5, 2001 3-month -year 10-year 3.59% 3.59% 3.59% 488% 539% 5.74% 13 10 Geometric mean Arithmetic mean 590% 7.50% Coupon 07/15/96 07/15/21 Current Price $ 95.60 1996 1997 1998 1999 2000 0.98 0 84 0.84 0.63 0.83 0.69 Nike share price on July 5, 2001 $ 42.09 Dixidond History and Feccast YTD 63001 1997 0.10 010 010 010 040 1998 0.12 012 0.12 0.12 04 1999 0.12 0.12 0.12 012 048 2000 012 012 0.12 0.12 0.48 2001 0.12 012 Average 0.80 FY 2002 S 232 s 267 FY 2003 5.50% " Data have been modifled for teaching purposes
Step by Step Solution
There are 3 Steps involved in it

Get step-by-step solutions from verified subject matter experts