

Question: Using this data what is the least squares regression line a equation AND interpret the slope. Use Statistical Software output to answer the following questions.
Using this data what is the least squares regression line a equation AND interpret the slope.
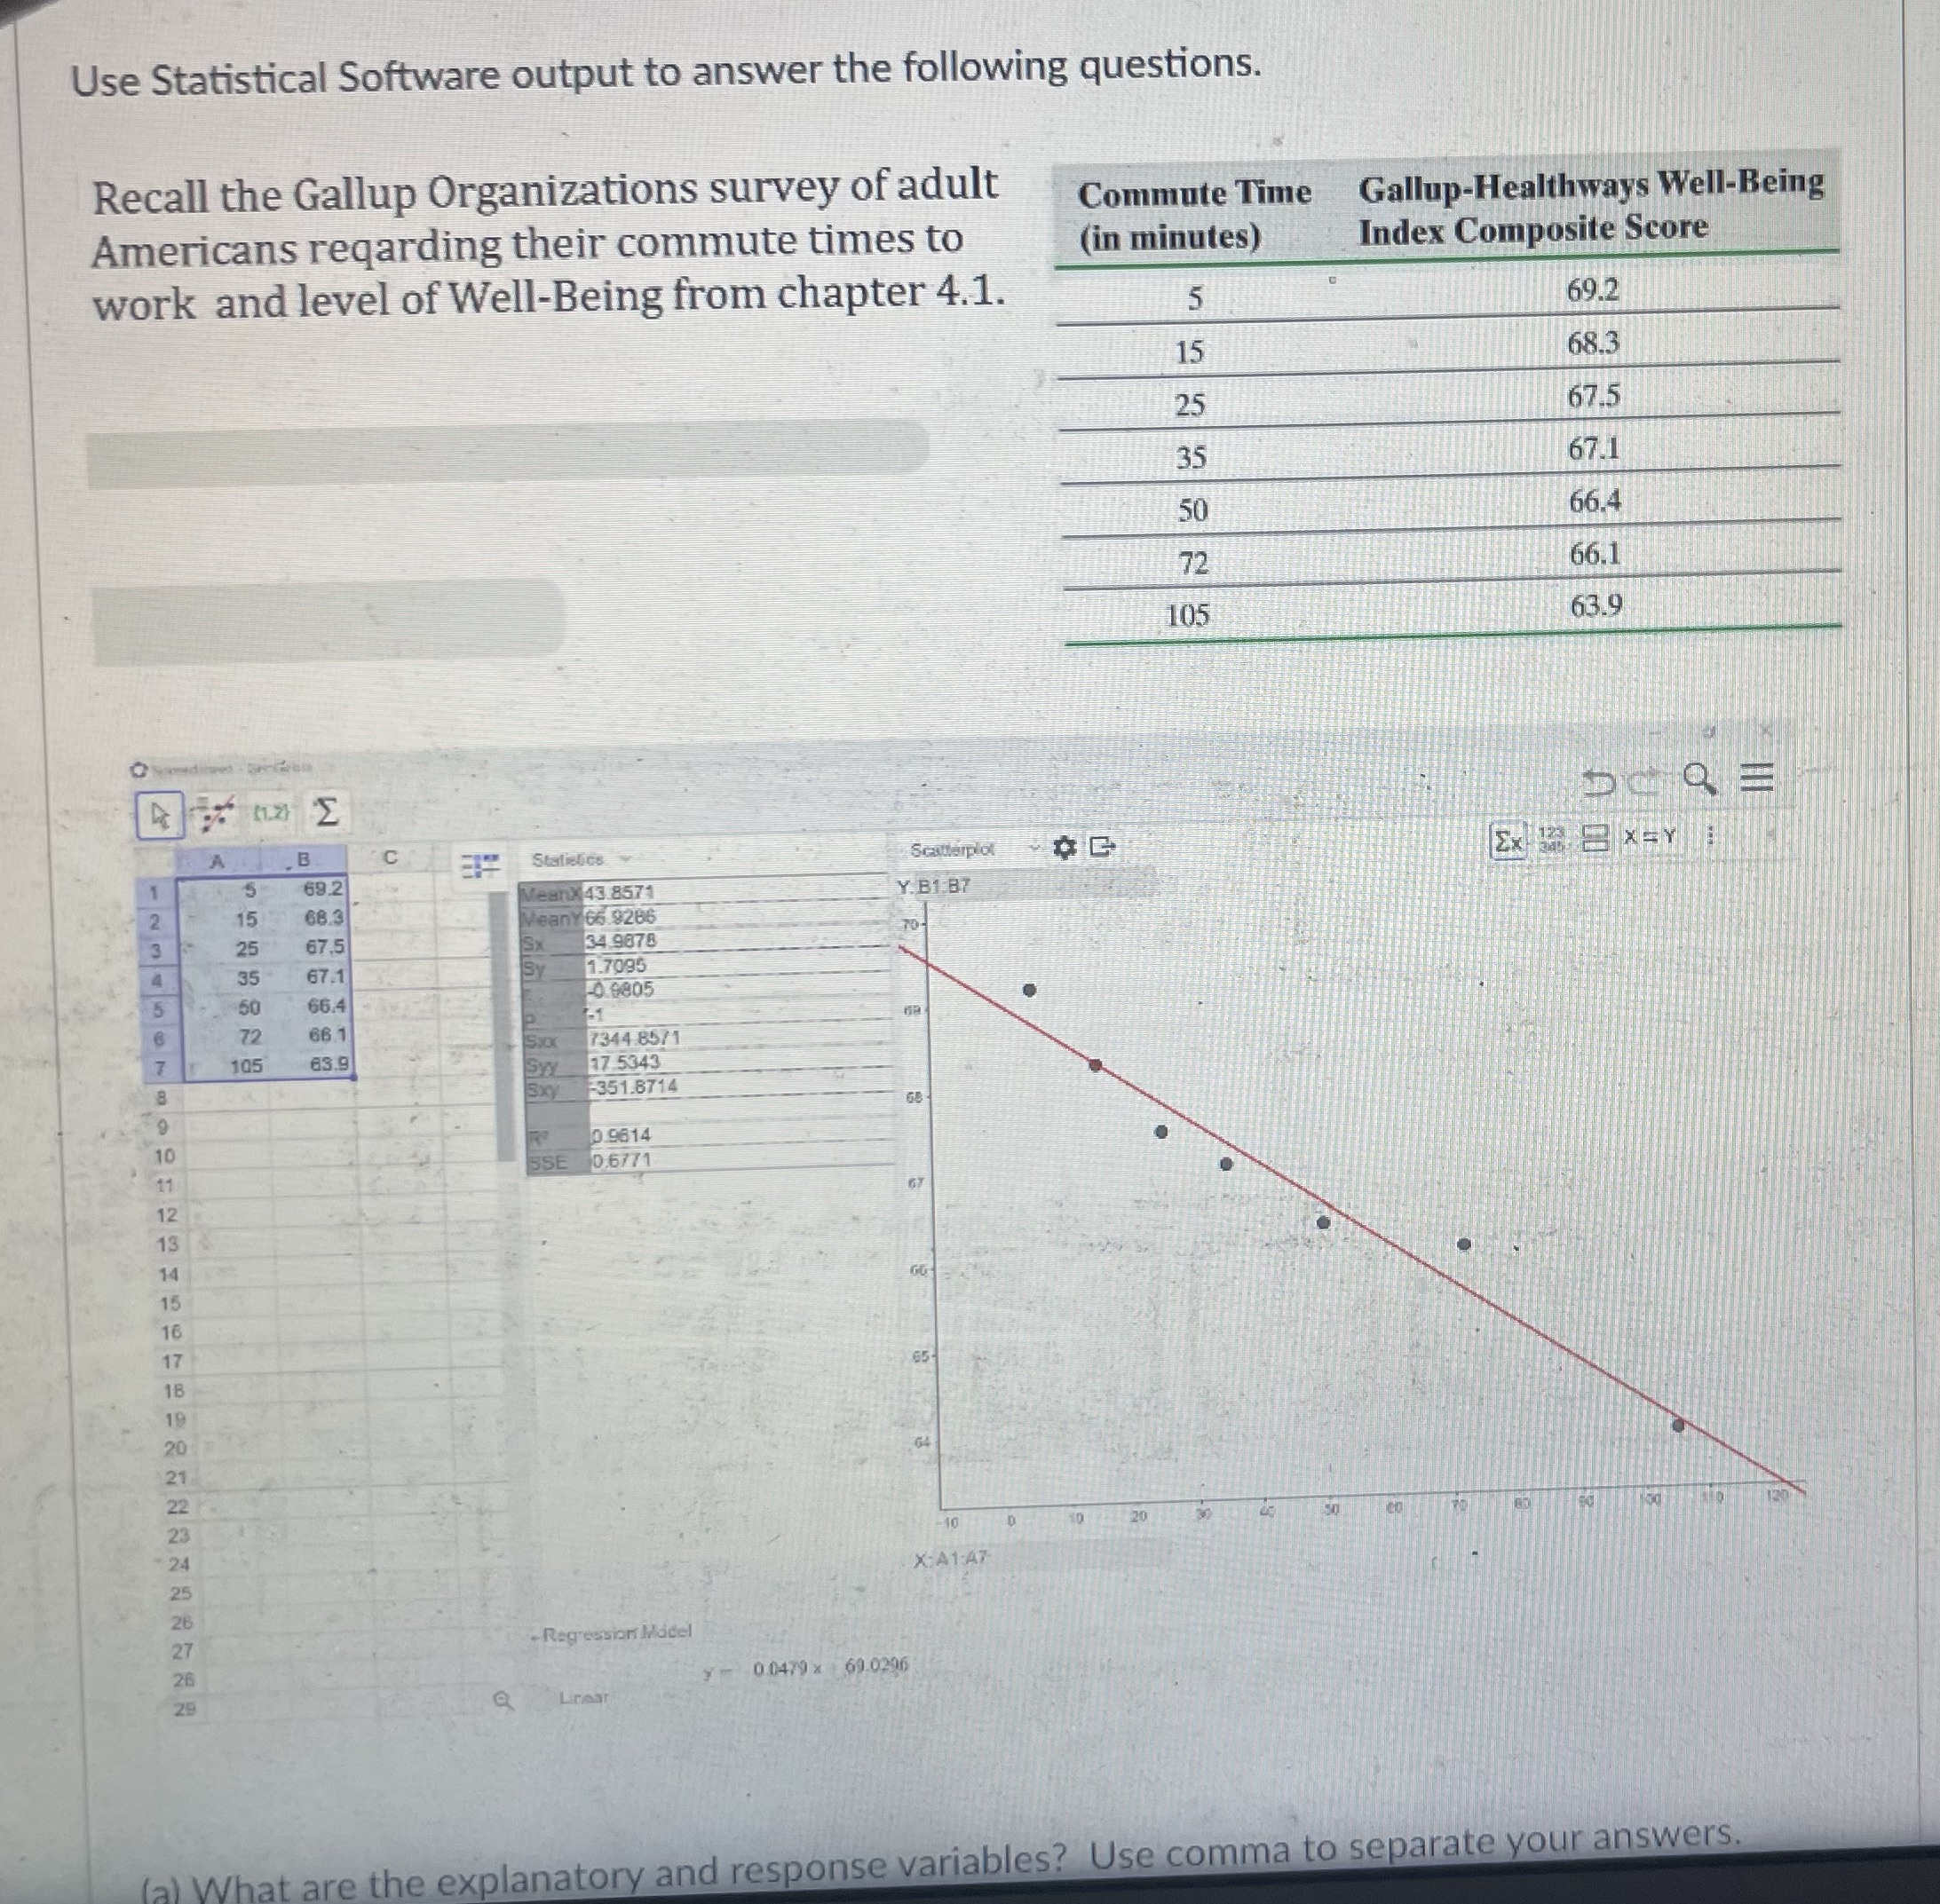
Use Statistical Software output to answer the following questions. Recall the Gallup Organizations survey of adult Commute Time Gallup-Healthways Well-Being Americans reqarding their commute times to (in minutes) Index Composite Score work and level of Well-Being from chapter 4.1. 5 69.2 15 68.3 25 67.5 35 67.1 50 66.4 72 66.1 105 63.9 C Stafielies Scatterplot 69.2 MeanX 43 8571 . B1:87 15 68.3 Meany 66 9206 25 67.5 34.9878 35 67.1 1.7095 50 664 -0.9805 72 66.1 7344 85/1 105 63.9 17 5343 Exy -351.8714 10 0.9814 0.6/71 11 X: A1:47 - Regression Model y - 0.0479 x 69.0296 (a) What are the explanatory and response variables? Use comma to separate your answers
Step by Step Solution
There are 3 Steps involved in it

Get step-by-step solutions from verified subject matter experts