

Question: Using this dataset that I made, how I would make a graph to show the correlation between wins with margin of victory, strength of schedule,
Using this dataset that I made, how I would make a graph to show the correlation between wins with margin of victory, strength of schedule, etc. And which type of graph would be the best to show this? I wanted to see which statistic has the strongest correlation with having the most wins and making playoffs. Can someone please help, I am struggling. This is in R by the way. Thank you
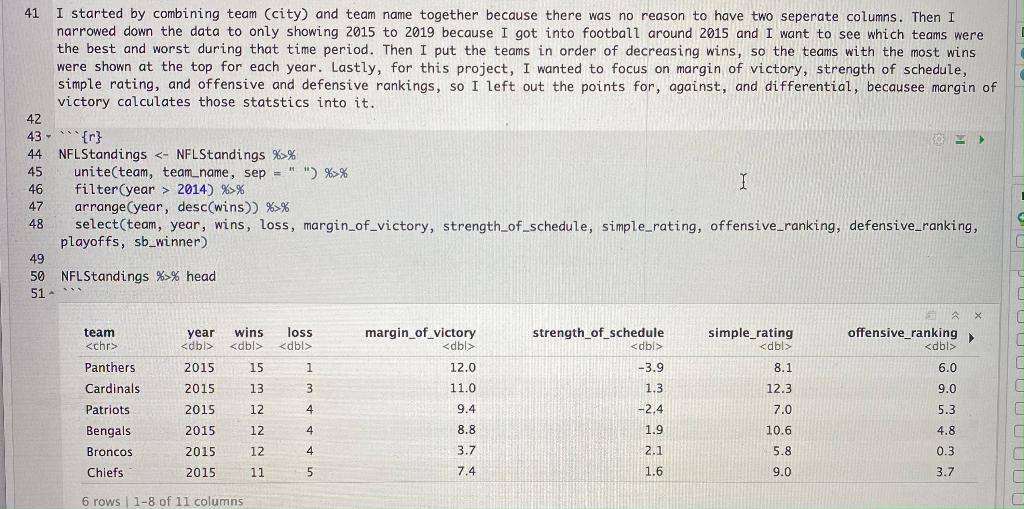
I started by combining team (city) and team name together because there was no reason to have two seperate columns. Then I narrowed down the data to only showing 2015 to 2019 because I got into football around 2015 and I want to see which teams were the best and worst during that time period. Then I put the teams in order of decreasing wins, so the teams with the most wins were shown at the top for each year. Lastly, for this project, I wanted to focus on margin of victory, strength of schedule, simple rating, and offensive and defensive rankings, so I left out the points for, against, and differential, becausee margin of victory calculates those statstics into it. NFLStandings %>% unite(team, team name, sep = iI") %>% filter ( year >2014)%>% arrange(year, desc(wins)) %% select(team, year, wins, loss, margin_of_victory, strength_of_schedule, simple_rating, offensive_ranking, defensive_ranking, playoffs, sb_winner) NFLStandings %>% head
Step by Step Solution
There are 3 Steps involved in it

Get step-by-step solutions from verified subject matter experts