

Question: Using this information, choose the correct Pareto chart below. A. Frequency (number 50- 40- 30- 20- 10- 0- D P G T E Parking/Drives
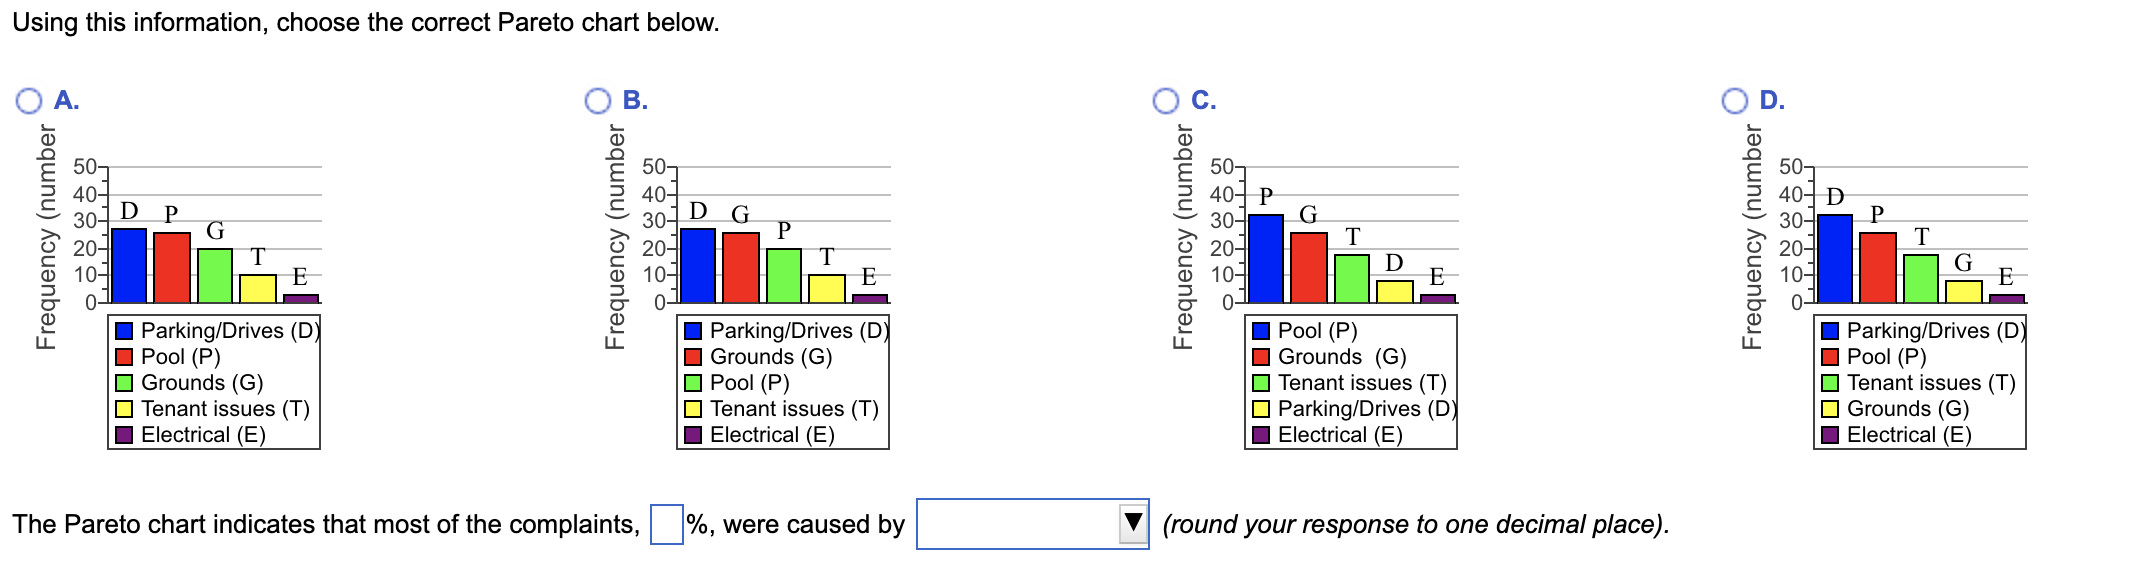
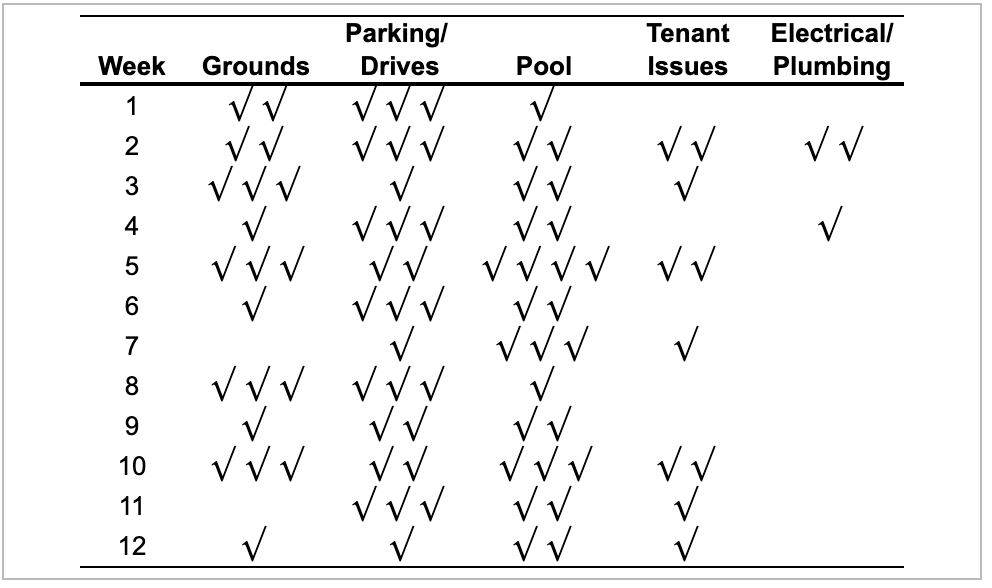
Using this information, choose the correct Pareto chart below. A. Frequency (number 50- 40- 30- 20- 10- 0- D P G T E Parking/Drives (D) Pool (P) Grounds (G) Tenant issues (T) Electrical (E) The Pareto chart indicates that most of the complaints, Frequency (number B. 50- 40- 30- D G P 20- T 10- E Parking/Drives (D) Grounds (G) Pool (P) Tenant issues (T) Electrical (E) %, were caused by Frequency (number C. 50- 40 P 30- 20 10- G T D 0- Pool (P) Grounds (G) Tenant issues (T) Parking/Drives (D) Electrical (E) (round your response to one decimal place). D. 50 40-D 30- P T 20- G 10- E Frequency (number Parking/Drives Pool (P) Tenant issues (T) Grounds (G) Electrical (E) Week Grounds Parking/ Drives Tenant Electrical/ Pool Issues Plumbing 1 2 3 4 5 6 7 8 9 == 10 11 12
Step by Step Solution
There are 3 Steps involved in it

Get step-by-step solutions from verified subject matter experts