

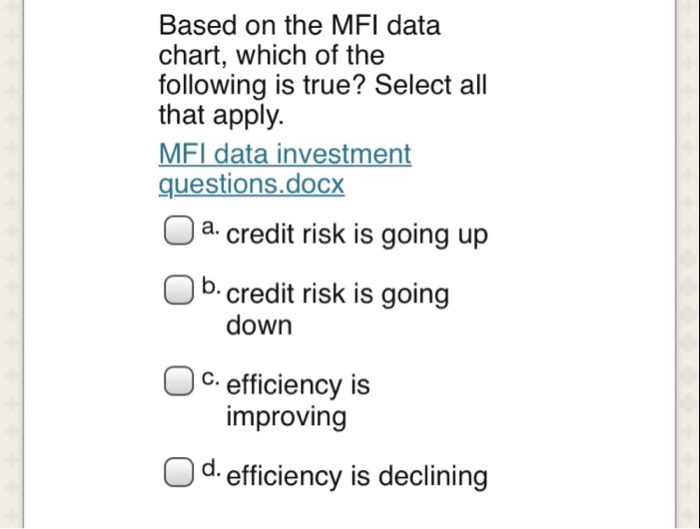
Question: Using this table to answer the question Based on the MFI data chart, which of thee following is true? Select all that apply. MFI data
 Using this table to answer the question
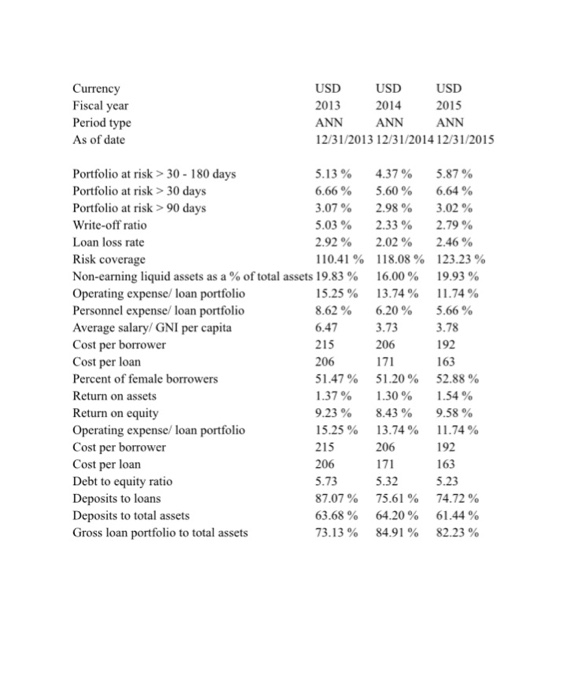
 Based on the MFI data chart, which of thee following is true? Select all that apply. MFI data investment questions.docx Oa. credit risk is going up 0 b. credit risk is going down Oc efficiency is improving d. efficiency is declining Fiscal year Period type As of date USDUSD USD 2013 2014 2015 ANN ANN ANN 12/31/2013 12/31/2014 12/31/2015 Portfolio at risk>30-180 days Portfolio at risk>30 days Portfolio at isk> 90 days Write-off ratio Loan loss rate Risk coverage Non-earning liquid assets as a % of total assets 19.83 % Operating expense/ loan portfolio Personnel expense/ loan portfolio Average salary/ GNI per capita Cost per borrower Cost per loan Percent of female borrowers Return on assets Return on equity Operating expense/ loan portfolio Cost per borrower Cost per loan Debt to equity ratio Deposits to loans Deposits to total assets 5.13% 6.66 % 3.07 % 5.03 % 2.92 % 110.41% 4.37 % 5.60 % 2.98 % 2.33 % 2.02 % 118.08 % 16.00 % 5.87 % 6.64 % 3.02 % 2.79 % 2.46 % 123.23 % 19.93 % 15.25 % 13.74 % 11.74% 8.62 % 6.20 % 5.66 % 6473.733.78 215 206 51.47 % 51.20 % 52.88 % 1.37 % 1.30 % 1.54 % 9.23 % 8.43 % 9.58% 15.25 % 13.74 % 11.74 % 215 192 163 206 192 163 5.73 5.325.23 87.07% 75.61 % 74.72 % 63.68 % 64.20 % 61.44 % 73.13% 84.91% 82.23 % Gross loan portfolio to total asset
Step by Step Solution
There are 3 Steps involved in it

Get step-by-step solutions from verified subject matter experts