

Question: Using those images provided, please completely interpret the findings to the horizontal analysis of apple's income statement. What are some primary drivers of the changes?
Using those images provided, please completely interpret the findings to the horizontal analysis of apple's income statement. What are some primary drivers of the changes?
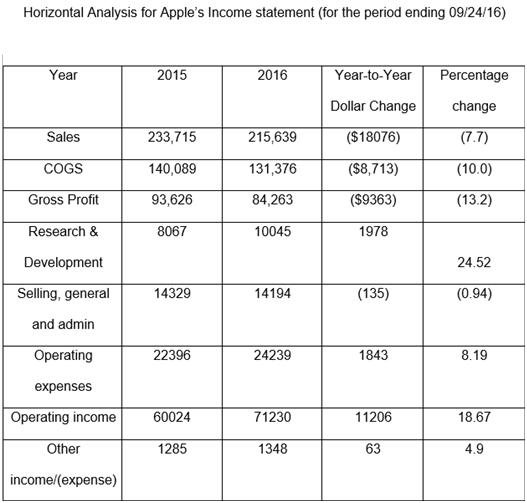
Horizontal Analysis for Apple's Income statement (for the period ending 09/24/16) Year 2015 2016 Year-to-Year Percentage Dollar Change change Sales 233,715 215,639 ($18076) (7.7) COGS 140,089 131,376 ($8,713) (10.0) Gross Profit 93,626 84,263 (S9363) (13.2) Research & 8067 10045 1978 Development 24.52 Selling, general 14329 14194 (135) (0.94) and admin Operating 22396 24239 1843 8.19 expenses Operating income 60024 71230 11206 18.67 Other 1285 1348 63 4.9 income/(expense)
Step by Step Solution
3.34 Rating (172 Votes )
There are 3 Steps involved in it

Get step-by-step solutions from verified subject matter experts