

Question: Using US CDC data of weekly flu estimates over a year, perform multivariate regression (in Matlab load flu). This data comprises weekly flu estimates
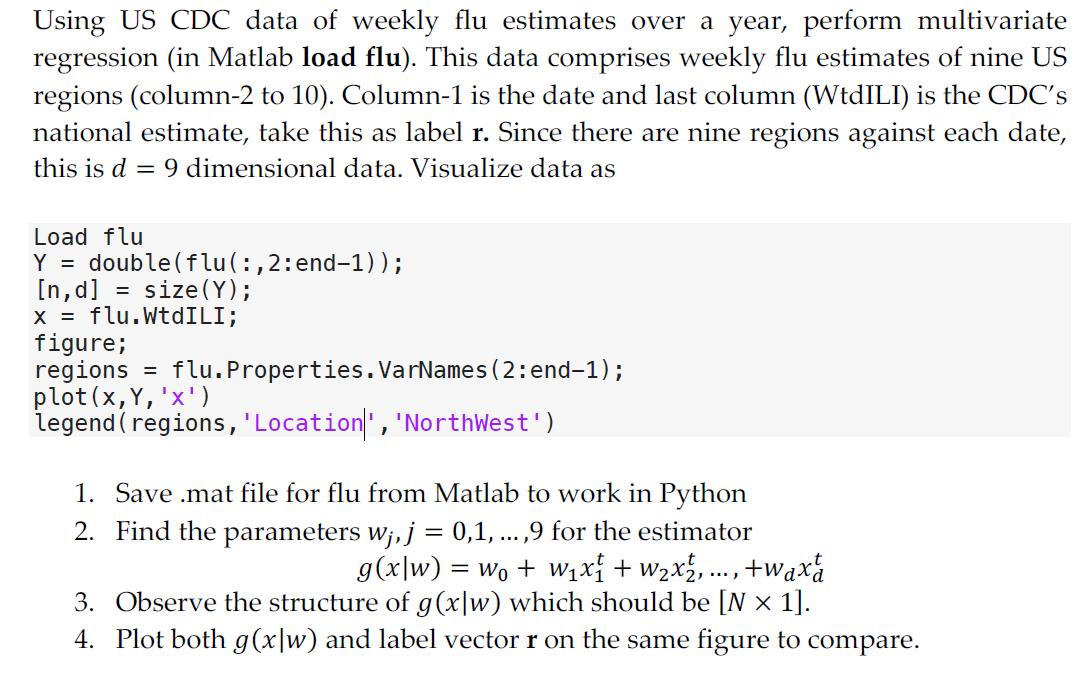
Using US CDC data of weekly flu estimates over a year, perform multivariate regression (in Matlab load flu). This data comprises weekly flu estimates of nine US regions (column-2 to 10). Column-1 is the date and last column (WtdILI) is the CDC's national estimate, take this as label r. Since there are nine regions against each date, this is d = 9 dimensional data. Visualize data as Load flu Y = double(flu(:, 2:end-1)); [nd] = size (Y); x = flu. WtdILI; figure; regions = flu.Properties. VarNames (2:end-1); plot(X, Y, 'x') legend (regions, 'Location', 'NorthWest') 1. Save .mat file for flu from Matlab to work in Python 2. Find the parameters wj, j = 0,1, ... ,9 for the estimator g(x|w) = wo + W x { + Wx, ..., +waxt 3. Observe the structure of g(x|w) which should be [N 1]. 4. Plot both g(x|w) and label vector r on the same figure to compare.
Step by Step Solution
There are 3 Steps involved in it
Step 1 Load and Visualize Data load flu Y doubleflu 2end1 n d sizeY x fluWtdILI figure regions fluPr... View full answer

Get step-by-step solutions from verified subject matter experts