

Question: Using your favorite statistics software package, you generate a scatter plot with a regression equation and correlation coefficient. The regression equation is reported as
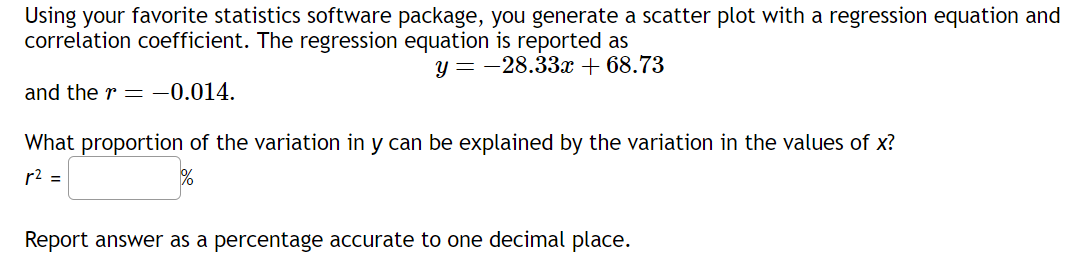
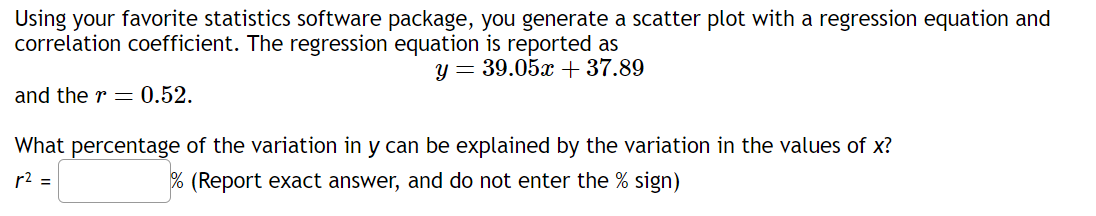
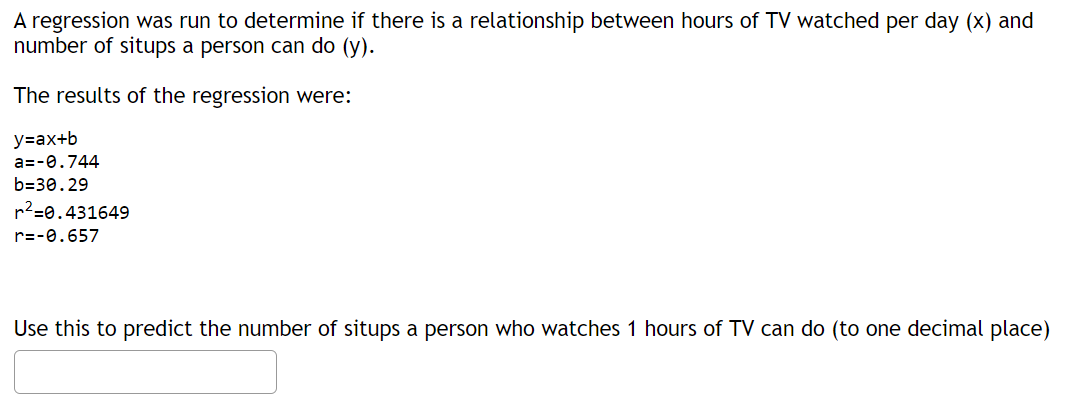
Using your favorite statistics software package, you generate a scatter plot with a regression equation and correlation coefficient. The regression equation is reported as and the r = -0.014. y=-28.33x + 68.73 What proportion of the variation in y can be explained by the variation in the values of x? r = % Report answer as a percentage accurate to one decimal place. Using your favorite statistics software package, you generate a scatter plot with a regression equation and correlation coefficient. The regression equation is reported as and the r = 0.52. y=39.05x + 37.89 What percentage of the variation in y can be explained by the variation in the values of x? r = % (Report exact answer, and do not enter the % sign) A regression was run to determine if there is a relationship between hours of TV watched per day (x) and number of situps a person can do (y). The results of the regression were: y=ax+b a=-0.744 b=30.29 r=0.431649 r=-0.657 Use this to predict the number of situps a person who watches 1 hours of TV can do (to one decimal place)
Step by Step Solution
There are 3 Steps involved in it

Get step-by-step solutions from verified subject matter experts