

Question: Using your graphing document, select the graph that best demonstrates both of the scenarios listed below: Consumers are told that the consumption of cauliflower will
Using your graphing document, select the graph that best demonstrates both of the scenarios listed below:
- Consumers are told that the consumption of cauliflower will significantly reduce the risk of cancer.
- A new fertilizer is developed that increases the yield each season for cauliflower producers.
What do you predict will happen to equilibrium price and quantity as a result of this change?
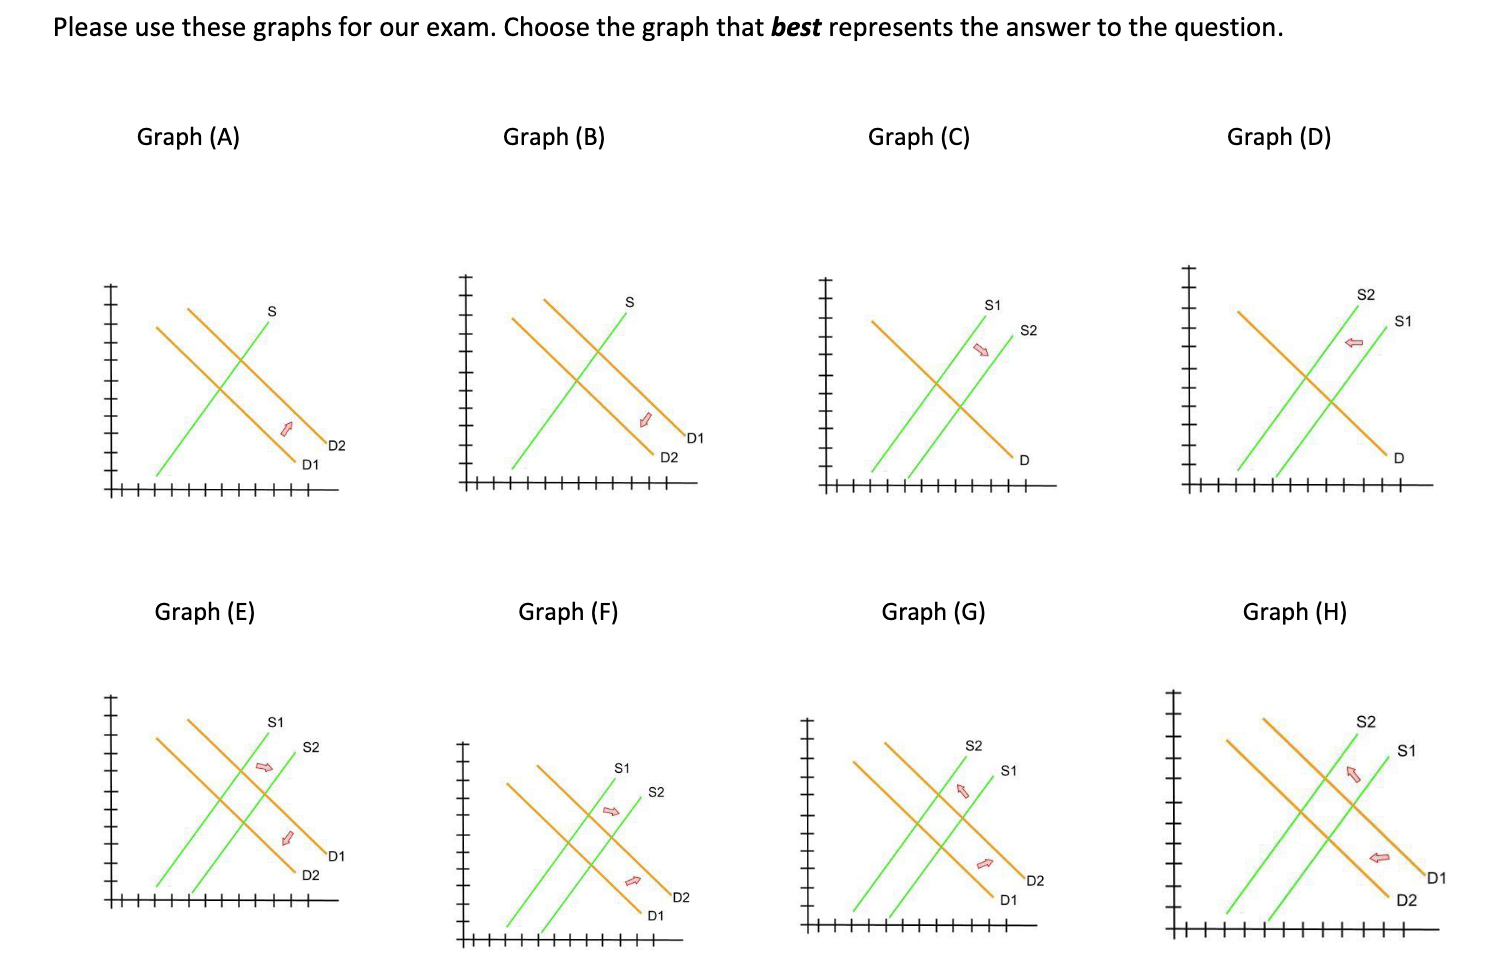
Please use these graphs for our exam. Choose the graph that best represents the answer to the question. Graph (A) Graph (E) 31 $2 Graph (B) Graph (F) S1 82 DZ D1 Graph (C) 31 52 m D Graph (G) 52 S1 R g: DZ D1 Graph (D) Graph (H) 32 82 S1 81
Step by Step Solution
There are 3 Steps involved in it
1 Expert Approved Answer
Step: 1 Unlock

Question Has Been Solved by an Expert!
Get step-by-step solutions from verified subject matter experts
Step: 2 Unlock
Step: 3 Unlock