

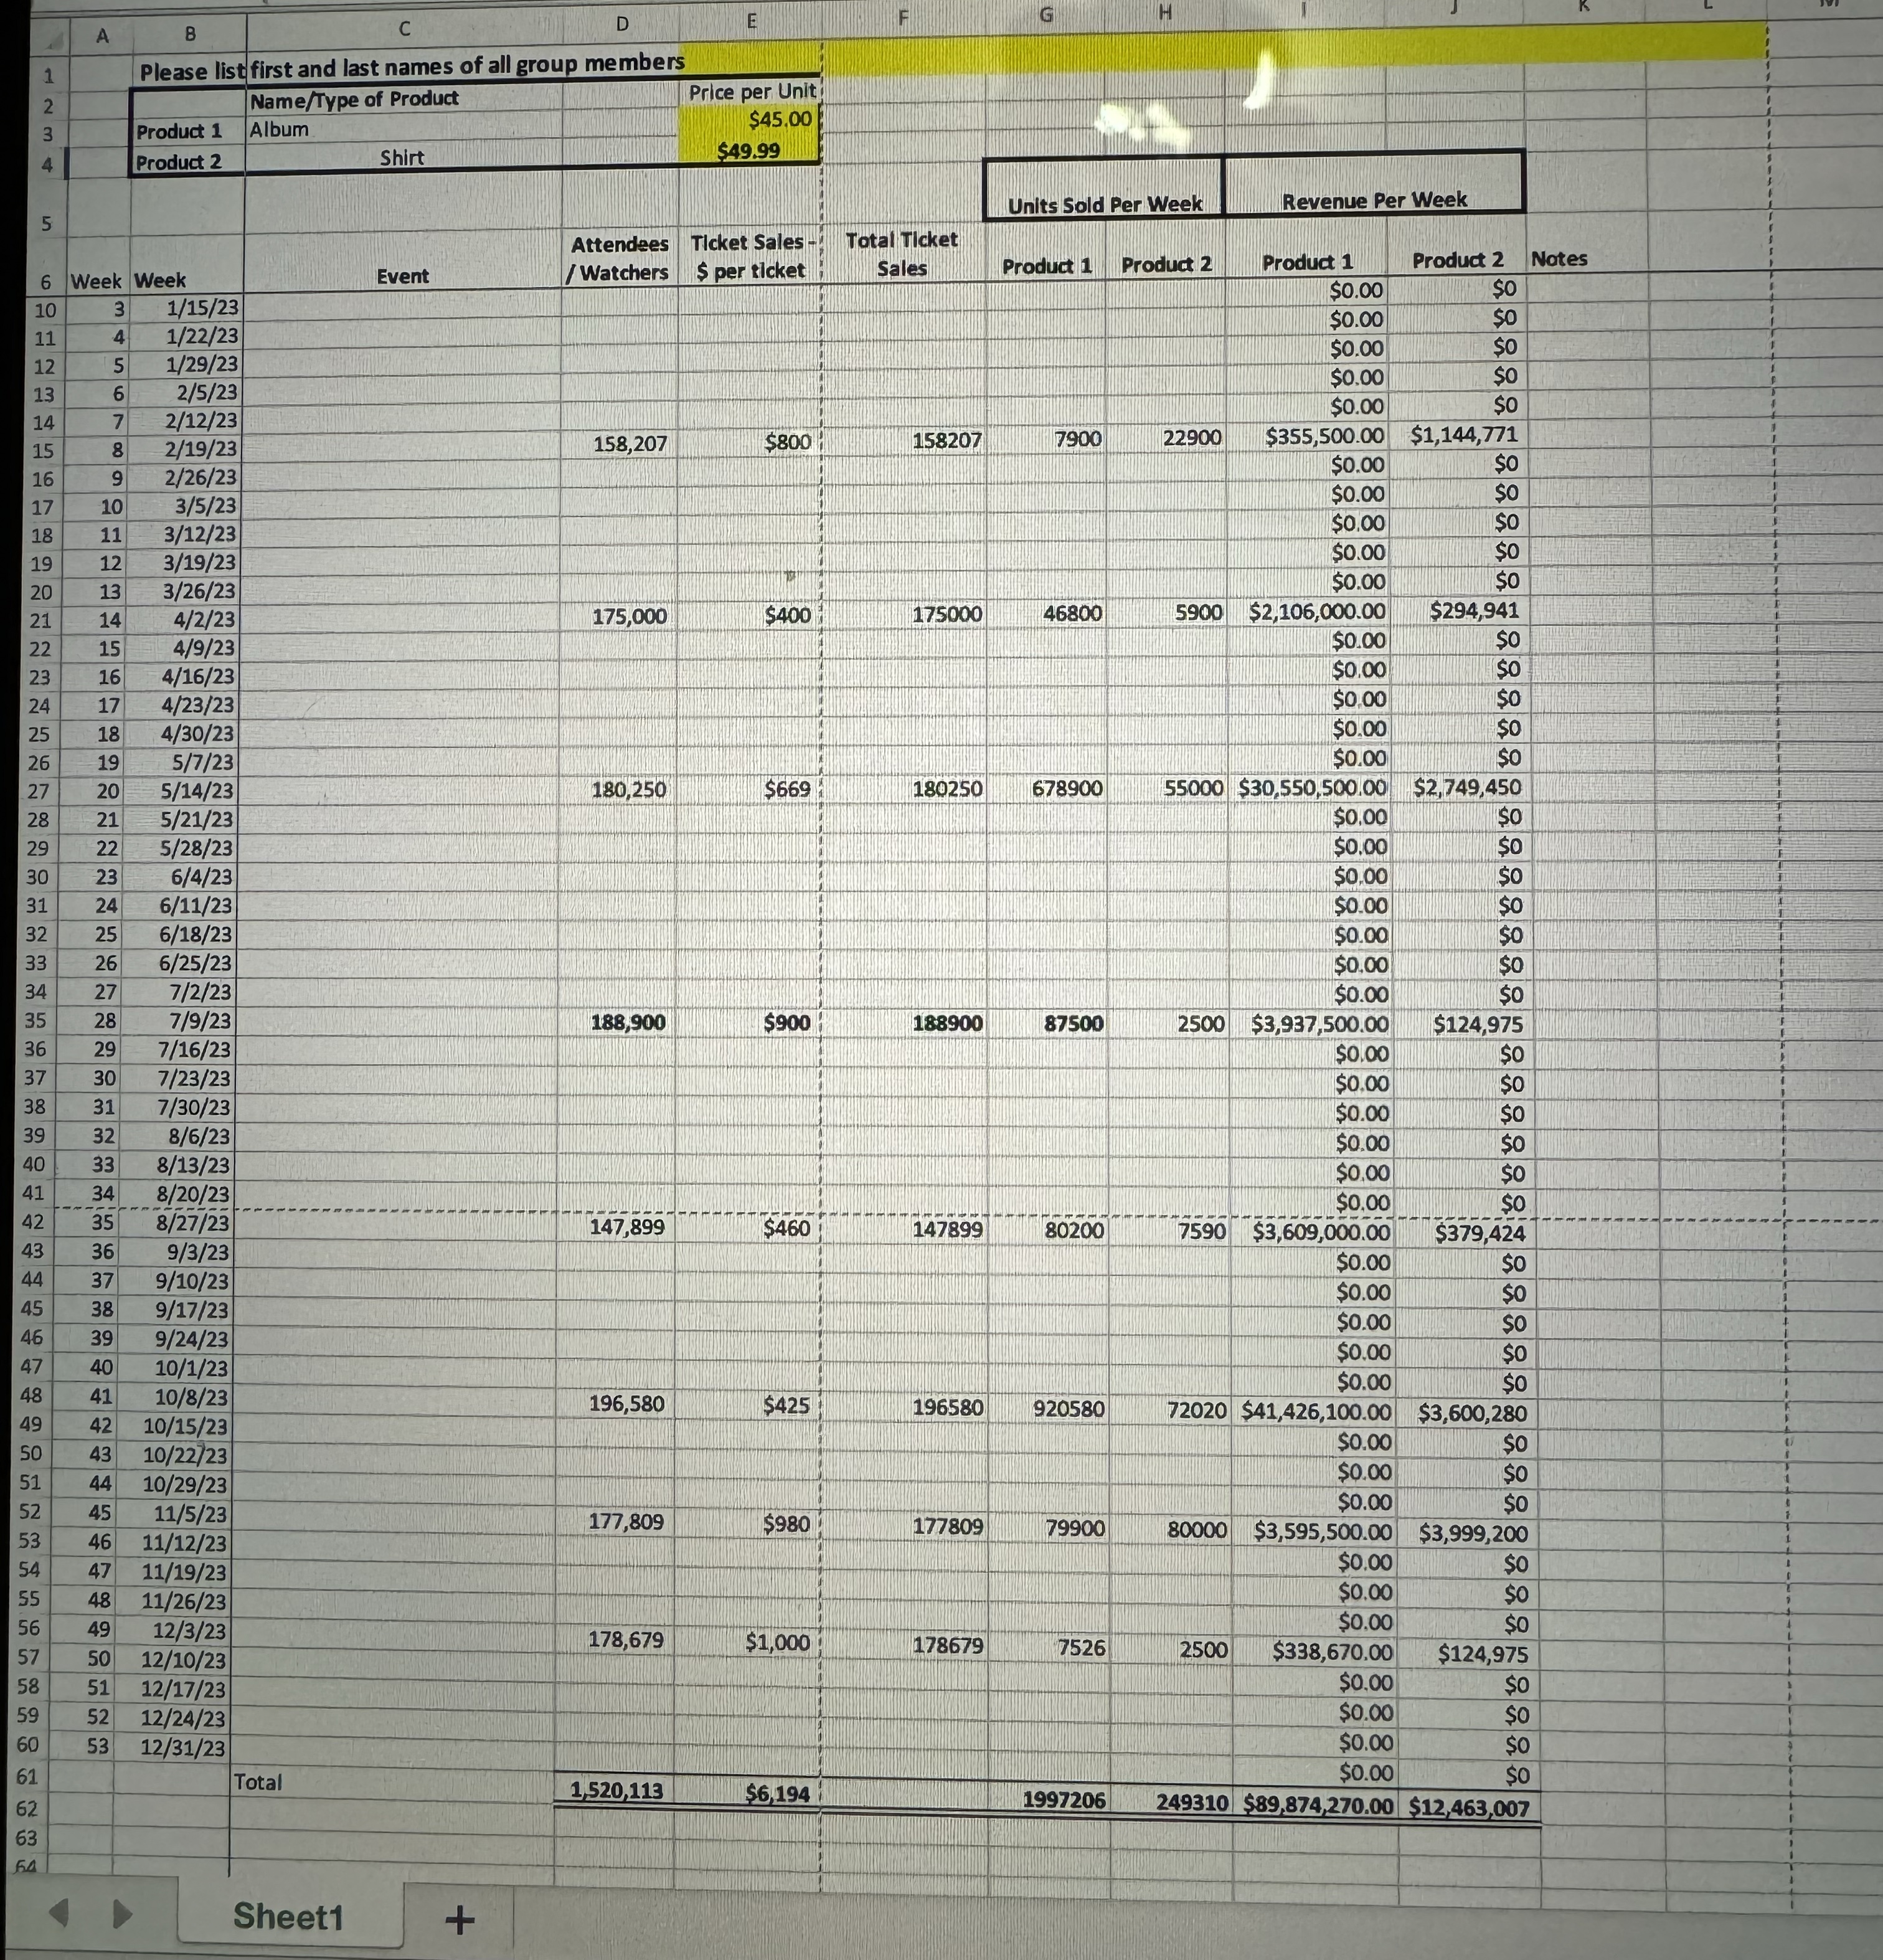
Question: Using your spreadsheet from Part 2 Graph your results by week on one axis and revenue on the other axisIn an additional column apply a
Using your spreadsheet from Part Graph your results by week on one axis and revenue on the other axisIn an additional column apply a week moving average to the revenue forecastAdd one more column and apply exponential smoothing using an a to the revenue forecastTo calculate your actual demand when calculating exponential smoothing.For the first weeks, assume actual demand was lower than your forecastFor the remaining weeks, assume actual demand is higher than your forecast.The easiest way to modify your forecast is to add another column for Actual DemandGraph # and # and compare the results to #Explain the differences between your three different forecasts and draw a conclusion
Step by Step Solution
There are 3 Steps involved in it
1 Expert Approved Answer
Step: 1 Unlock

Question Has Been Solved by an Expert!
Get step-by-step solutions from verified subject matter experts
Step: 2 Unlock
Step: 3 Unlock