

Question: Utility Function Graph Question 4a. Figure 1 on the right shows Bad Betty's Utility Figure 1 utility function, relating her income to her total utility.
Utility Function Graph Question
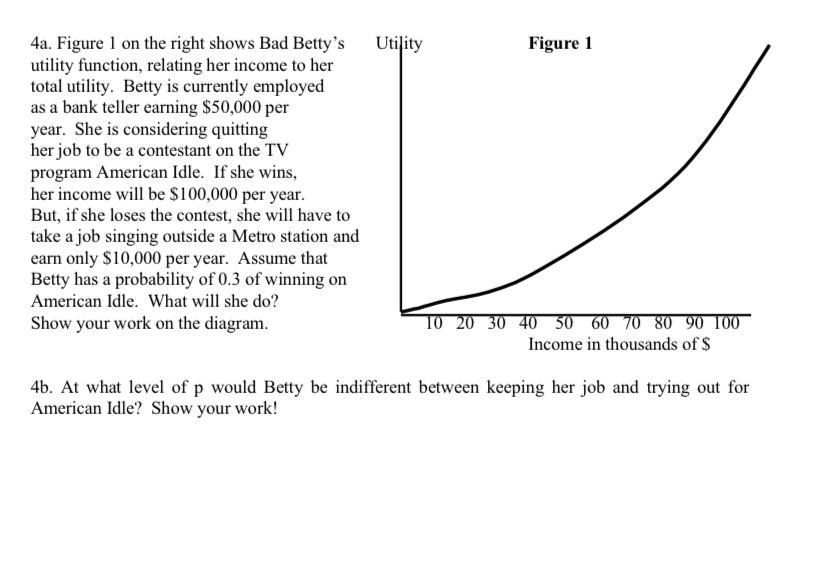
4a. Figure 1 on the right shows Bad Betty's Utility Figure 1 utility function, relating her income to her total utility. Betty is currently employed as a bank teller earning $50,000 per year. She is considering quitting her job to be a contestant on the TV program American Idle. If she wins, her income will be $100,000 per year. But, if she loses the contest, she will have to take a job singing outside a Metro station and earn only $10,000 per year. Assume that Betty has a probability of 0.3 of winning on American Idle. What will she do? Show your work on the diagram. 10 20 30 40 50 60 70 80 90 100 Income in thousands of $ 4b. At what level of p would Betty be indifferent between keeping her job and trying out for American Idle? Show your work
Step by Step Solution
There are 3 Steps involved in it

Get step-by-step solutions from verified subject matter experts