

Question: ution.com/flow/connect.html Saved Blooper's analysts have come up with the following revised estimates for its magnoosium mine: Initial investment Revenues Variable costs Fixed cost Working capital
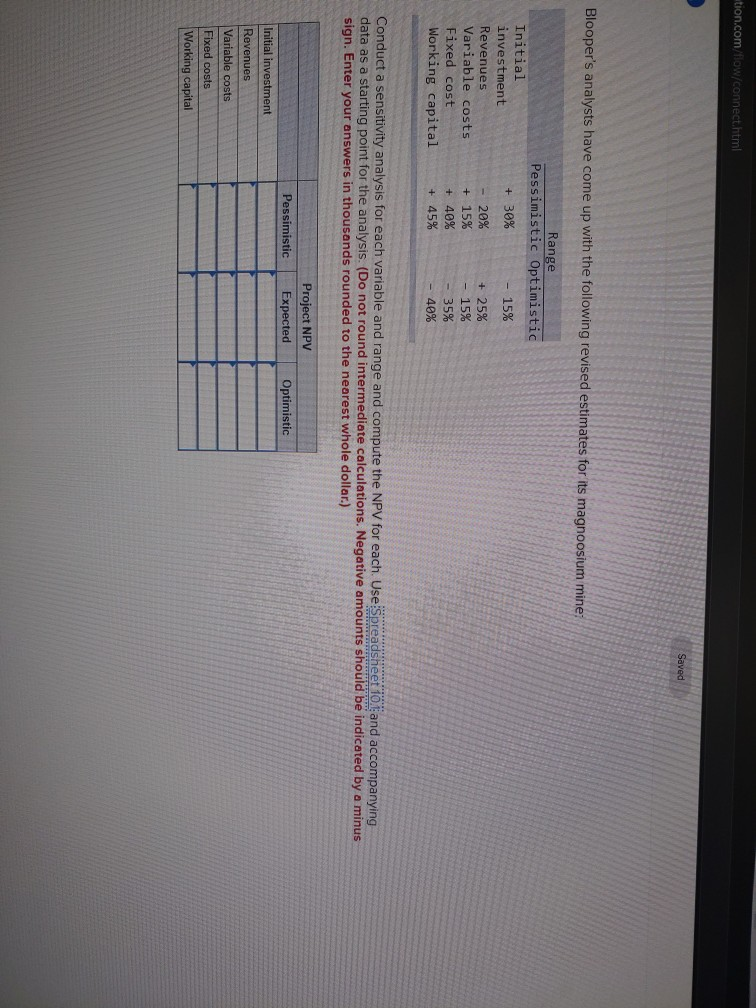
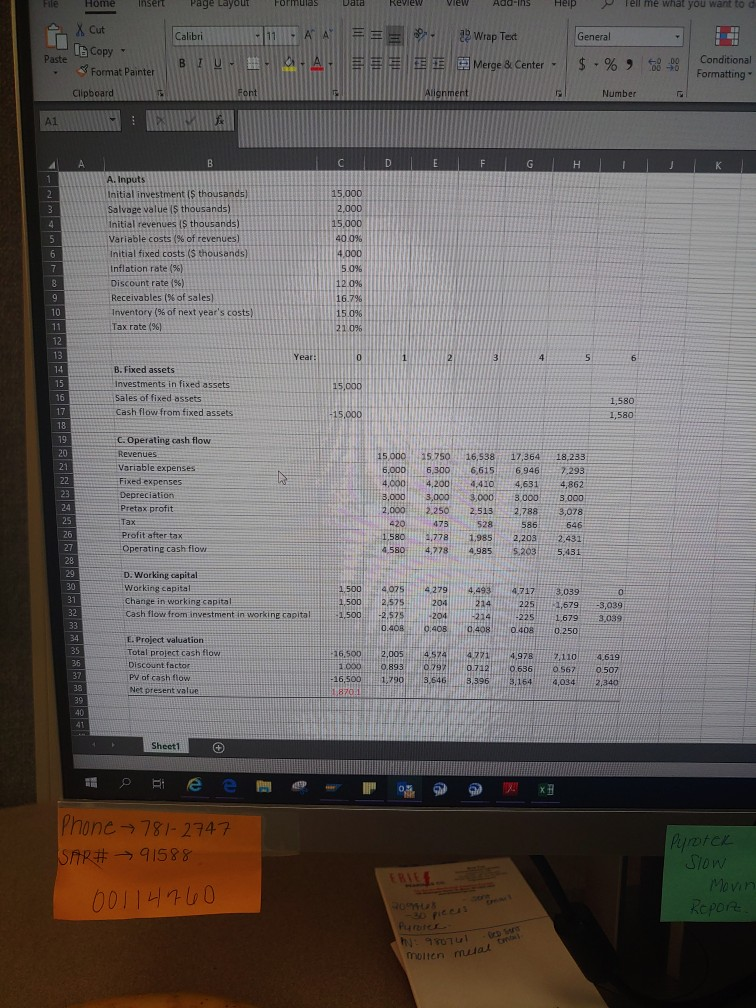
ution.com/flow/connect.html Saved Blooper's analysts have come up with the following revised estimates for its magnoosium mine: Initial investment Revenues Variable costs Fixed cost Working capital Range Pessimistic Optimistic + 30% - 15% - 20% + 25% + 15% - 15% + 40% 35% + 45% - 40% Conduct a sensitivity analysis for each variable and range and compute the NPV for each. Use Spreadsheet 10.1 and accompanying data as a starting point for the analysis. (Do not round intermediate calculations. Negative amounts should be indicated by a minus sign. Enter your answers in thousands rounded to the nearest whole dollar.) Project NPV Expected Pessimistic Optimistic Initial investment Revenues Variable costs Fixed costs Working capital File Home Insert Page Layout Formulas Data Review View Add-ins Help Tell me what you want to di a Calibri General X Cut Copy 3 Format Painter 29 Wrap Test Merge & Center - Paste BIURA $ - % 68-08 Conditional Formatting Clipboard Alignment Number C D E F G H I J K L A. Inputs Initial investment is thousands) Salvage value is thousands) Initial revenues I thousands) Variable costs % of revenues) Initial fixed costs ( thousands) Inflation rate (%) Discount rate (%) Receivables (% of sales) Inventory (% of next year's costs) Tax rate (%) B. Fixed assets Investments in fixed assets Sales of fixed assets Cash flow from fixed assets 15,000 1.580 -15,000 1,580 15.000 15 750 6,300 4,200 C. Operating cash flow Revenues Variable expenses Fixed expenses Depreciation Pretax profit Tax Profit after tax Operating cash flow 3.000 16,53817,364 18,233 6.615 69462293 4,410 4,631 4,862 3,000 3.000 3.000 2513 2,788 3,078 646 1,985 2,203 2,431 4.985 5.203 5,431 2.250 586 4,778 4,778 4279 D. Working capital Working capital Change in working capital Cash flow from investment in working capital 4,7173 039 1,679 1,679 0.408 0.250 -3,039 3039 0:40B L. Project valuation Total project cash flow Discount factor PV of cash flow Net present value 4,9782.1104,619 0.636 0.567 0.507 3.154 4,0342 340 40 41 Sheet1 10 Ate e pe F 009 x Phone 781-2747 SAR# 91588 Pyrotek Slow Movin ROPOR: 00114760 MUS - pie Pure hi 80 e molten mual ution.com/flow/connect.html Saved Blooper's analysts have come up with the following revised estimates for its magnoosium mine: Initial investment Revenues Variable costs Fixed cost Working capital Range Pessimistic Optimistic + 30% - 15% - 20% + 25% + 15% - 15% + 40% 35% + 45% - 40% Conduct a sensitivity analysis for each variable and range and compute the NPV for each. Use Spreadsheet 10.1 and accompanying data as a starting point for the analysis. (Do not round intermediate calculations. Negative amounts should be indicated by a minus sign. Enter your answers in thousands rounded to the nearest whole dollar.) Project NPV Expected Pessimistic Optimistic Initial investment Revenues Variable costs Fixed costs Working capital File Home Insert Page Layout Formulas Data Review View Add-ins Help Tell me what you want to di a Calibri General X Cut Copy 3 Format Painter 29 Wrap Test Merge & Center - Paste BIURA $ - % 68-08 Conditional Formatting Clipboard Alignment Number C D E F G H I J K L A. Inputs Initial investment is thousands) Salvage value is thousands) Initial revenues I thousands) Variable costs % of revenues) Initial fixed costs ( thousands) Inflation rate (%) Discount rate (%) Receivables (% of sales) Inventory (% of next year's costs) Tax rate (%) B. Fixed assets Investments in fixed assets Sales of fixed assets Cash flow from fixed assets 15,000 1.580 -15,000 1,580 15.000 15 750 6,300 4,200 C. Operating cash flow Revenues Variable expenses Fixed expenses Depreciation Pretax profit Tax Profit after tax Operating cash flow 3.000 16,53817,364 18,233 6.615 69462293 4,410 4,631 4,862 3,000 3.000 3.000 2513 2,788 3,078 646 1,985 2,203 2,431 4.985 5.203 5,431 2.250 586 4,778 4,778 4279 D. Working capital Working capital Change in working capital Cash flow from investment in working capital 4,7173 039 1,679 1,679 0.408 0.250 -3,039 3039 0:40B L. Project valuation Total project cash flow Discount factor PV of cash flow Net present value 4,9782.1104,619 0.636 0.567 0.507 3.154 4,0342 340 40 41 Sheet1 10 Ate e pe F 009 x Phone 781-2747 SAR# 91588 Pyrotek Slow Movin ROPOR: 00114760 MUS - pie Pure hi 80 e molten mual
Step by Step Solution
There are 3 Steps involved in it

Get step-by-step solutions from verified subject matter experts