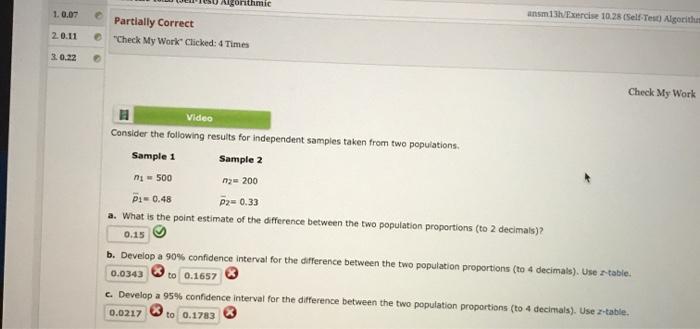
Question: uzonthmic 10.07 unsmis Exercise 10.28 (Self-Test Algorithm 2.0.11 Partially Correct Check My Work Clicked: 4 Times 3.0.22 Check My Work Video Consider the following results

uzonthmic 10.07 unsmis Exercise 10.28 (Self-Test
uzonthmic 10.07 unsmis Exercise 10.28 (Self-Test Algorithm 2.0.11 Partially Correct "Check My Work Clicked: 4 Times 3.0.22 Check My Work Video Consider the following results for independent samples taken from two populations Sample 1 Sample 2 ni = 500 me 200 Di=0.48 P2= 0.33 a. What is the point estimate of the difference between the two population proportions (to 2 decimals)? 0.15 b. Develop a 90% confidence interval for the difference between the two population proportions (to 4 decimals). Use 2-table. 0.0343 to 0.1657 c. Develop a 95% confidence interval for the difference between the two population proportions (to 4 decimals). Use z-table. 0.0217 to 0.1783 2.0.11 "Check My Work" Clicked: 1 Time 3.0.22 Video Consider the hypothesis test below. Ho: p1-P230 HO:P1-P2 > 0 The following results are for independent samples taken from the two populations. Sample 1 Sample 2 ni 100 02 300 P1 = 0.28 P2 -0.17 Use pooled estimator of p. a. What is the value of the test statistic (to 2 decimals)? b. What is the p-value (to 4 decimals)? Use 2-table, c. With a = .05, what is your hypothesis testing conclusion? Conclude the difference between the proportions is greater than 0 Video A Businessweek/Harris survey asked senior executives at large corporations their opinions about the economic outlook for the future. One question was, "Do you think that there will be an increase in the number of full-time employees at your company over the next 12 months?" In the current survey, 220 of 400 executives answered Yes, while in a previous year survey, 191 of 400 executives had answered Yes. Provide a 95% confidence interval estimate for the difference between the proportions at the two points in time (to 4 decimals). Use z-table. What is your interpretation of the interval estimate? 7.25% more executives are predicting an increase : in full-time jobs. The confidence interval shows the difference may be from 04 to 149

Step by Step Solution

There are 3 Steps involved in it

1 Expert Approved Answer
Step: 1 Unlock blur-text-image
Question Has Been Solved by an Expert!

Get step-by-step solutions from verified subject matter experts

Step: 2 Unlock
Step: 3 Unlock

Students Have Also Explored These Related General Management Questions!