

Question: v 1 Data table (In thousands) 2018 2017 2016 2015 2014 Net sales.. $ 616 $ 502 $ 313 $ 300 356 $ 15 Net
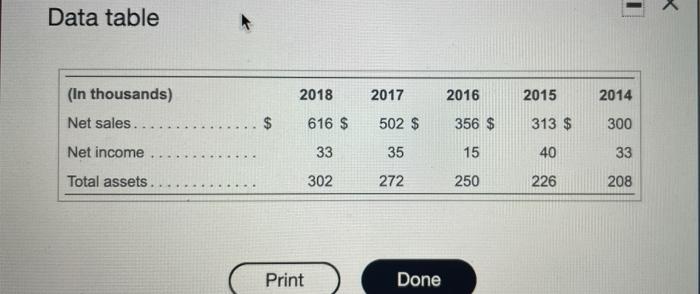
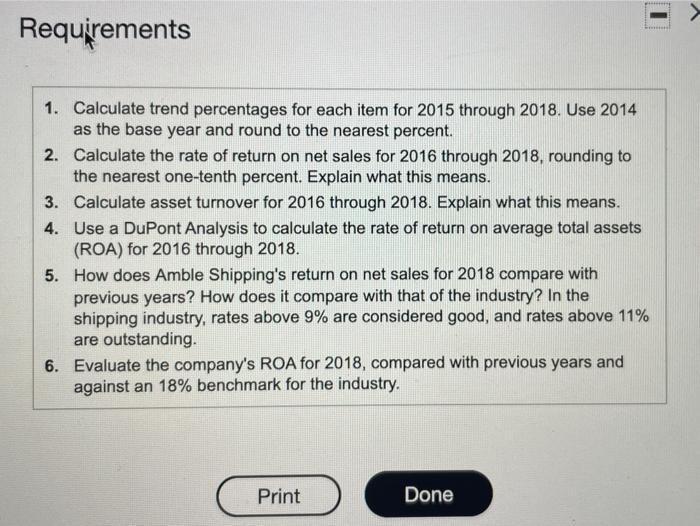
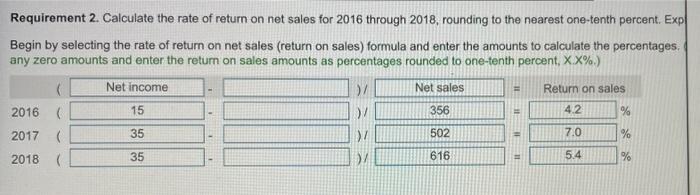
1 Data table (In thousands) 2018 2017 2016 2015 2014 Net sales.. $ 616 $ 502 $ 313 $ 300 356 $ 15 Net income 33 35 40 33 Total assets. 302 272 250 226 208 Print Done Requirements 1. Calculate trend percentages for each item for 2015 through 2018. Use 2014 as the base year and round to the nearest percent. 2. Calculate the rate of return on net sales for 2016 through 2018, rounding to the nearest one-tenth percent. Explain what this means. 3. Calculate asset turnover for 2016 through 2018. Explain what this means. 4. Use a DuPont Analysis to calculate the rate of return on average total assets (ROA) for 2016 through 2018. 5. How does Amble Shipping's return on net sales for 2018 compare with previous years? How does it compare with that of the industry? In the shipping industry, rates above 9% are considered good, and rates above 11% are outstanding. 6. Evaluate the company's ROA for 2018, compared with previous years and against an 18% benchmark for the industry. Print Done Requirement 2. Calculate the rate of return on net sales for 2016 through 2018, rounding to the nearest one-tenth percent. Expl Begin by selecting the rate of return on net sales (return on sales) formula and enter the amounts to calculate the percentages. any zero amounts and enter the return on sales amounts as percentages rounded to one-tenth percent, X.X%) Net income ) Return on sales 2016 ( 15 2017 ( 502 % 2018 35 Net sales ) 356 4.2 % 35 17 7.0 . 616 5.4 %
Step by Step Solution
There are 3 Steps involved in it

Get step-by-step solutions from verified subject matter experts