

Question: v $5 CM10 P CI X A Graph hMathc Graph , Search () HotBo I * solve f *Home Mathv G Solve C Chat -
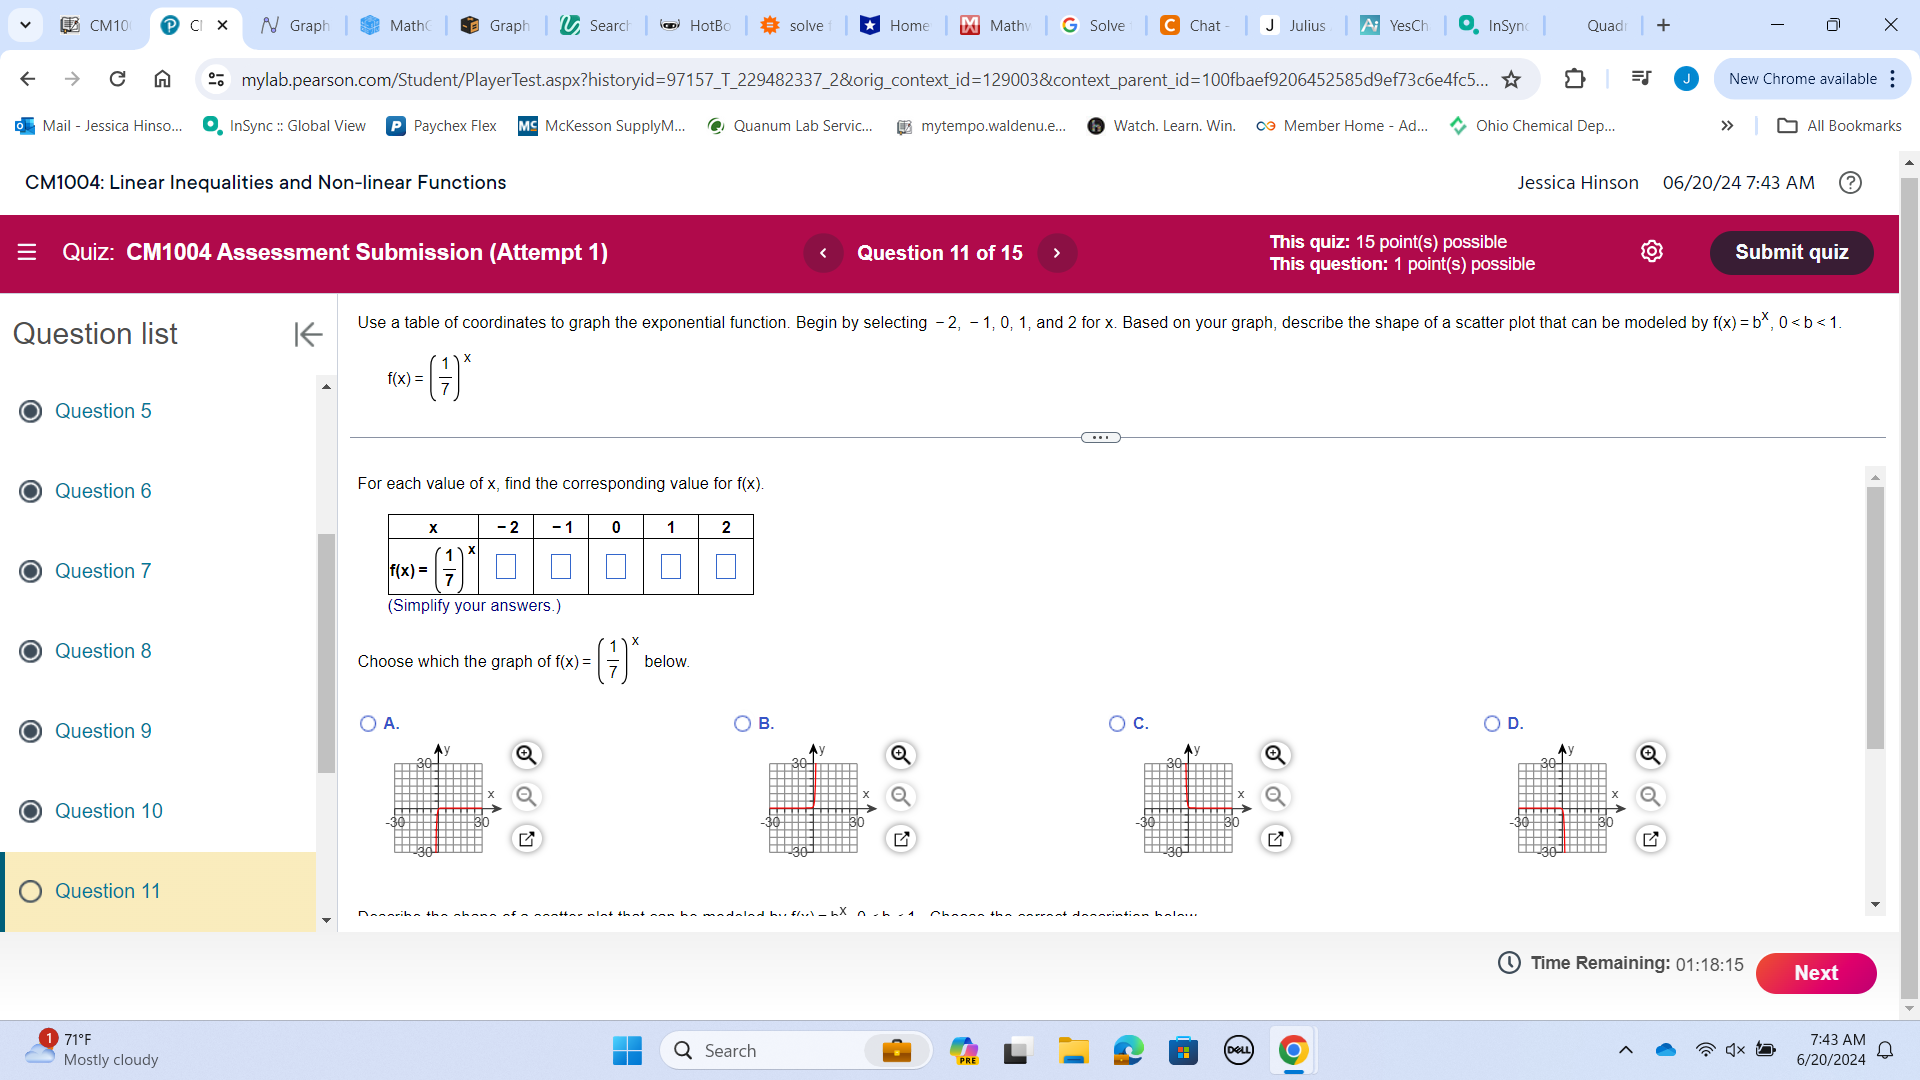
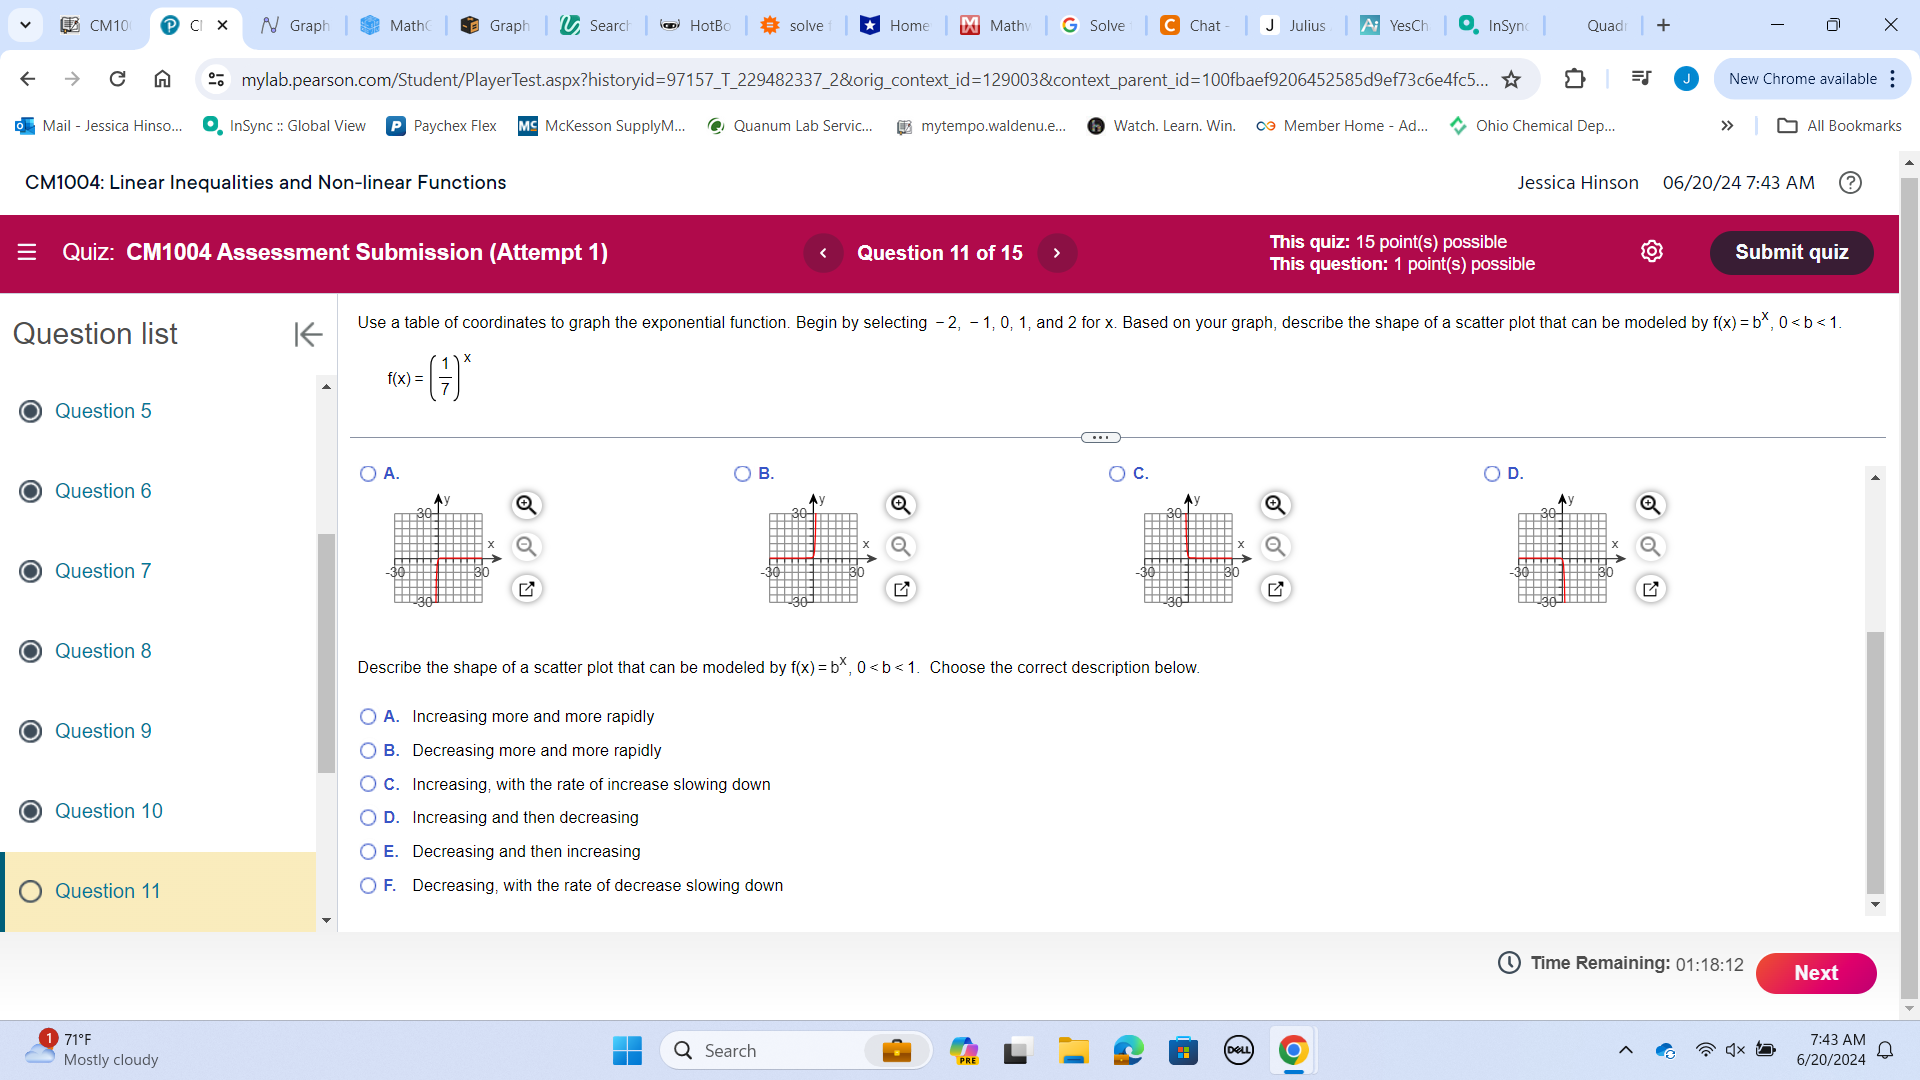
v $5 CM10 P CI X A Graph hMathc Graph , Search () HotBo I * solve f *Home Mathv G Solve C Chat - J Julius A: YesCh | . InSync | Quadr + X F mylab.pearson.com/Student/PlayerTest.aspx?historyid=97157_T_229482337_2&orig_context_id=129003&context_parent_id=100fbaef9206452585dgef73c6e4fc5... New Chrome available : Mail - Jessica Hinso... . InSync : Global View P Paychex Flex Mc Mckesson SupplyM... @ Quanum Lab Servic... [ mytempo.waldenu.e... Watch. Learn. Win. co Member Home - Ad... Ohio Chemical Dep... > > All Bookmarks CM1004: Linear Inequalities and Non-linear Functions Jessica Hinson 06/20/24 7:43 AM E Quiz: CM1004 Assessment Submission (Attempt 1) Question 11 of 15 This quiz: 15 point(s) possible This question: 1 point(s) possible Submit quiz Question list K Use a table of coordinates to graph the exponential function. Begin by selecting - 2, - 1, 0, 1, and 2 for x. Based on your graph, describe the shape of a scatter plot that can be modeled by f(x) = b*, 0 > All Bookmarks CM1004: Linear Inequalities and Non-linear Functions Jessica Hinson 06/20/24 7:43 AM E Quiz: CM1004 Assessment Submission (Attempt 1) Question 11 of 15 This quiz: 15 point(s) possible This question: 1 point(s) possible Submit quiz Question list K Use a table of coordinates to graph the exponential function. Begin by selecting - 2, - 1, 0, 1, and 2 for x. Based on your graph, describe the shape of a scatter plot that can be modeled by f(x) = b*, 0
Step by Step Solution
There are 3 Steps involved in it

Get step-by-step solutions from verified subject matter experts