

Question: V ng.cengage.com Home Page - Tarrant County College CQ TCC Jhoel v My Home Courses Catalog and Study Tools Rental Options College Success Tips Career
V
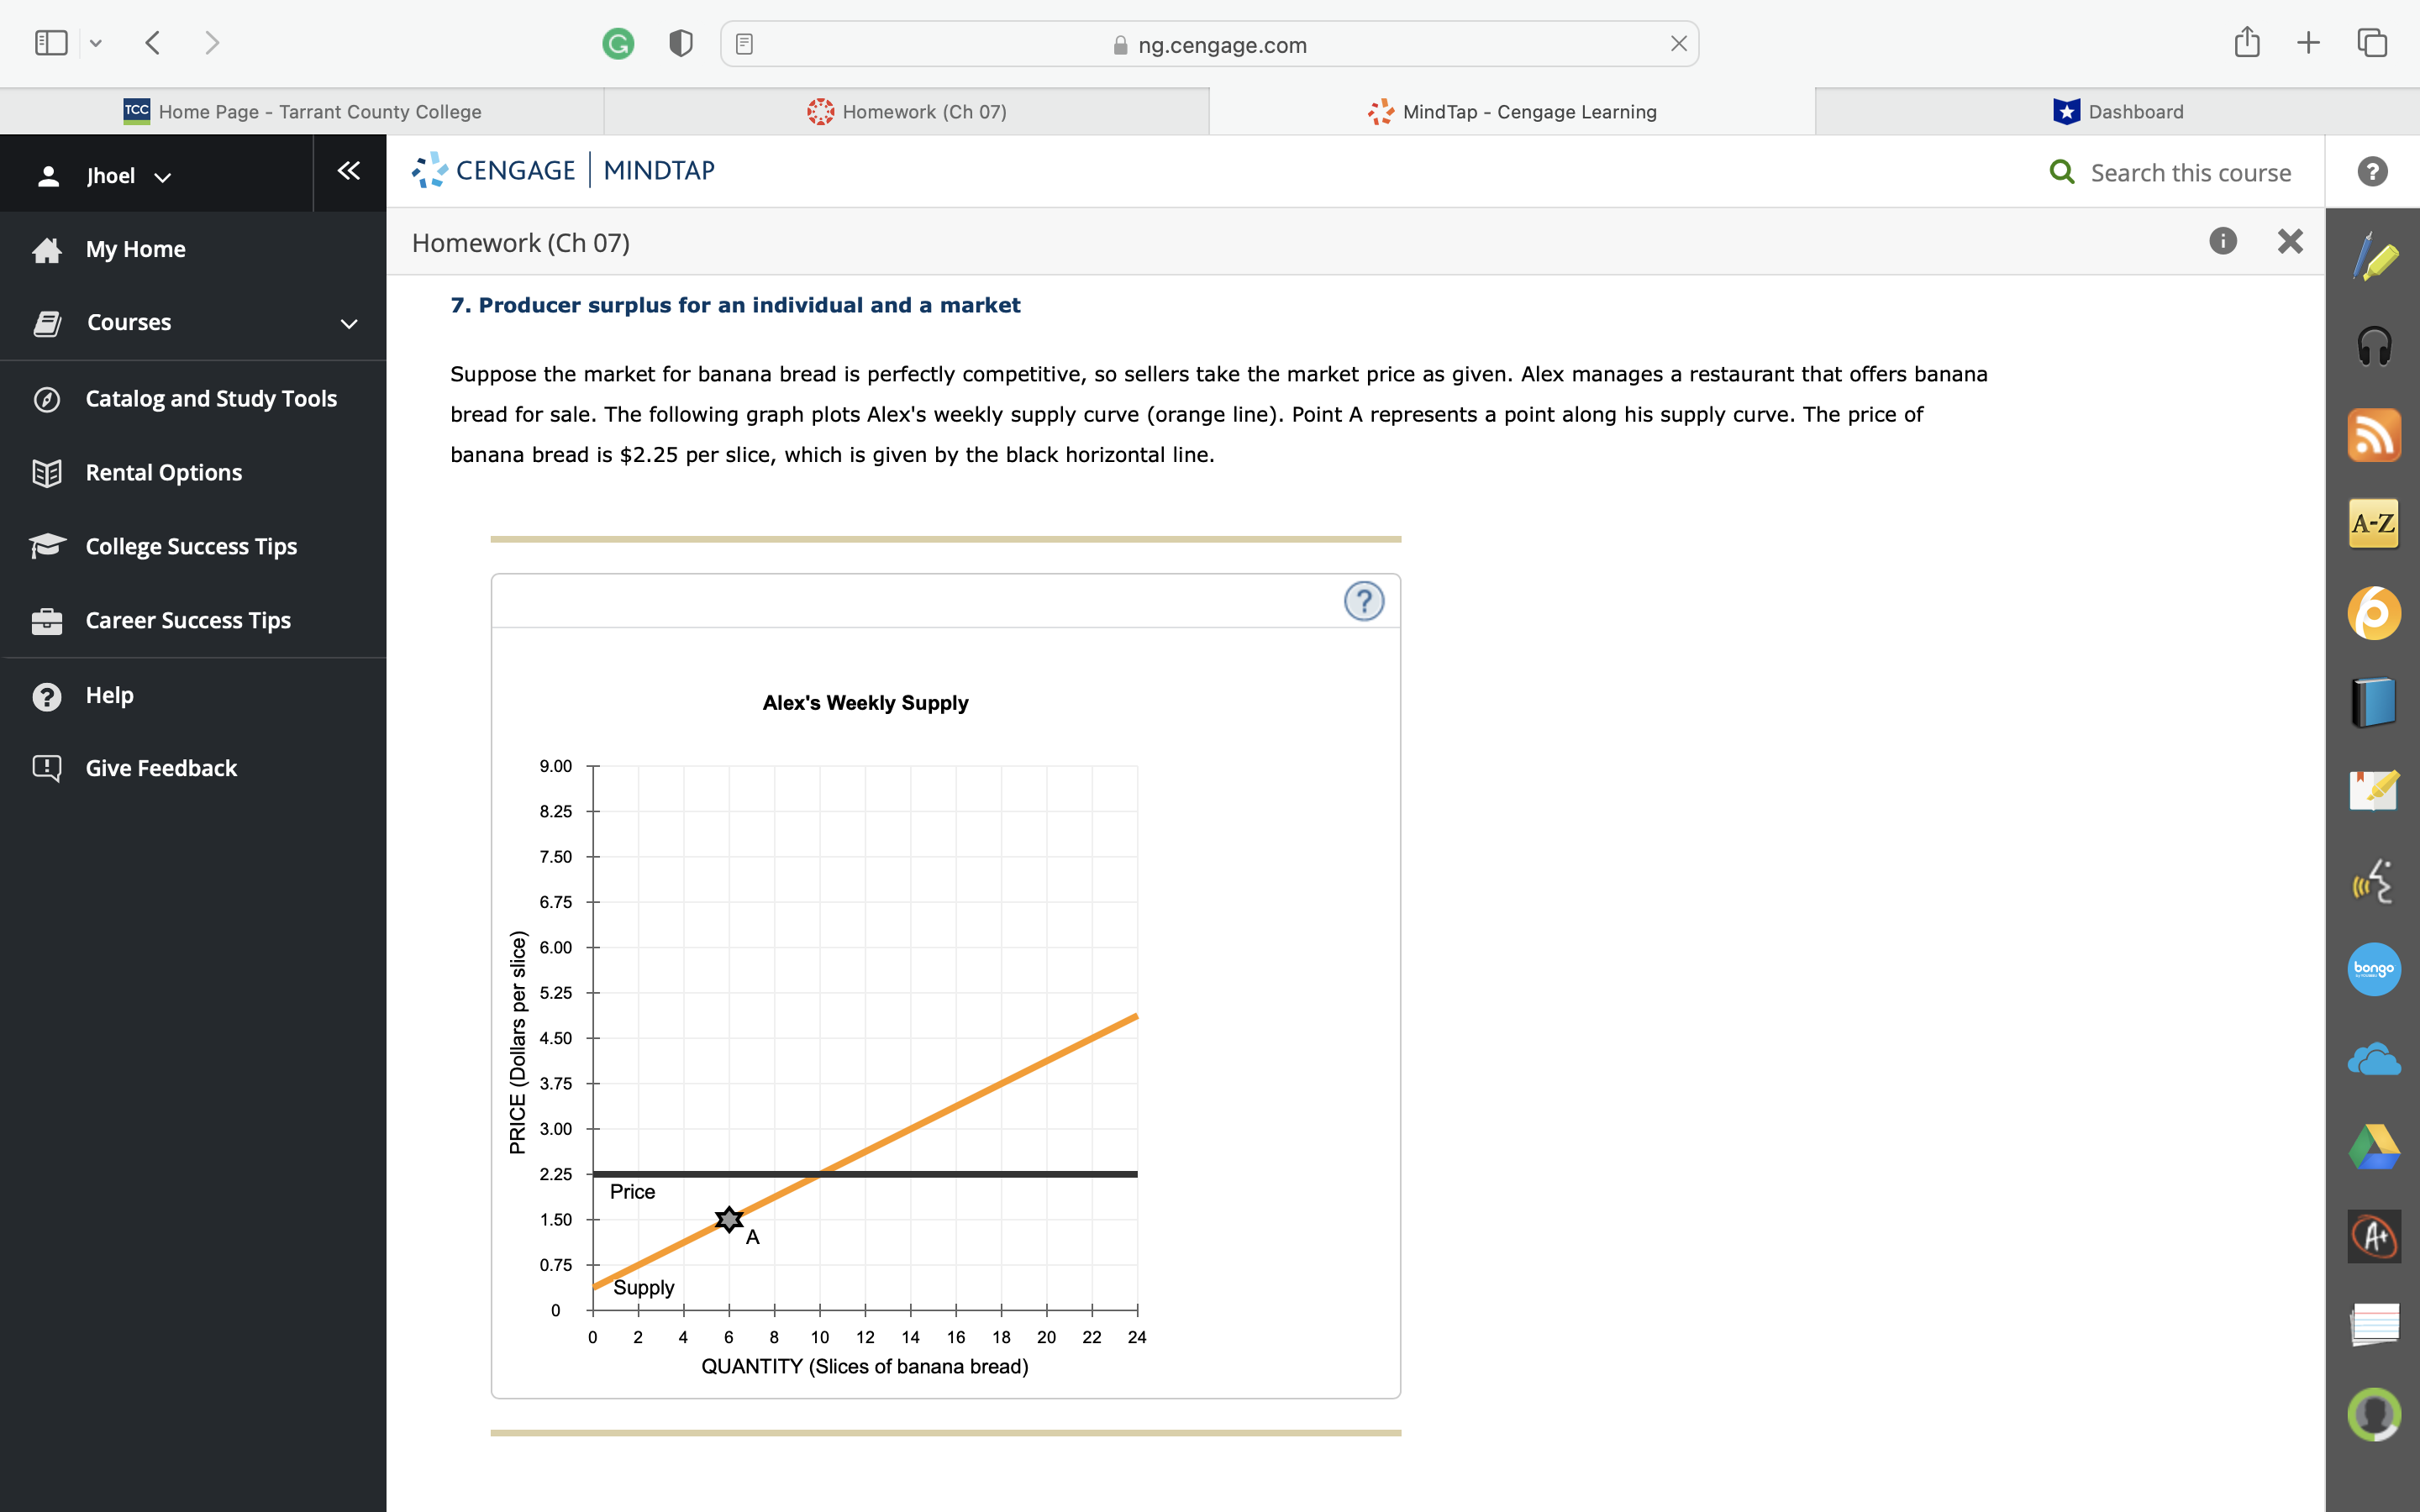
ng.cengage.com Home Page - Tarrant County College CQ TCC Jhoel v My Home Courses Catalog and Study Tools Rental Options College Success Tips Career Success Tips Help Give Feedback Homework (Ch 07) ; MindTap - Cengage Learning CENGAGE I MINDTAP Homework (Ch 07) 7. Producer surplus for an individual and a market Suppose the market for banana bread is perfectly competitive, so sellers take the market price as given. Alex manages a restaurant that offers banana bread for sale. The following graph plots Alex's weekly supply curve (orange line). Point A represents a point along his supply curve. The price of banana bread is $2.25 per slice, which is given by the black horizontal line. Dashboard Q Search this course Alex's Weekly Supply 9.00 8.25 7.50 6.75 @ 600 b 5.25 4.50 3.75 3.00 2.25 Price 1.50 0.75 upply 10 12 14 16 18 20 QUANTITY (Slices of banana bread) 22 24
Step by Step Solution
There are 3 Steps involved in it

Get step-by-step solutions from verified subject matter experts