

Question: V a S 3:15 Tin Week 7 (07 Mar - 11 Mar) (page x + X C @ https://moodle2.maths.ed.ac.uk/live2018/mod/quiz/attempt.php?attempt=671608&cmid=5533&page=3 to ... Below is an incomplete
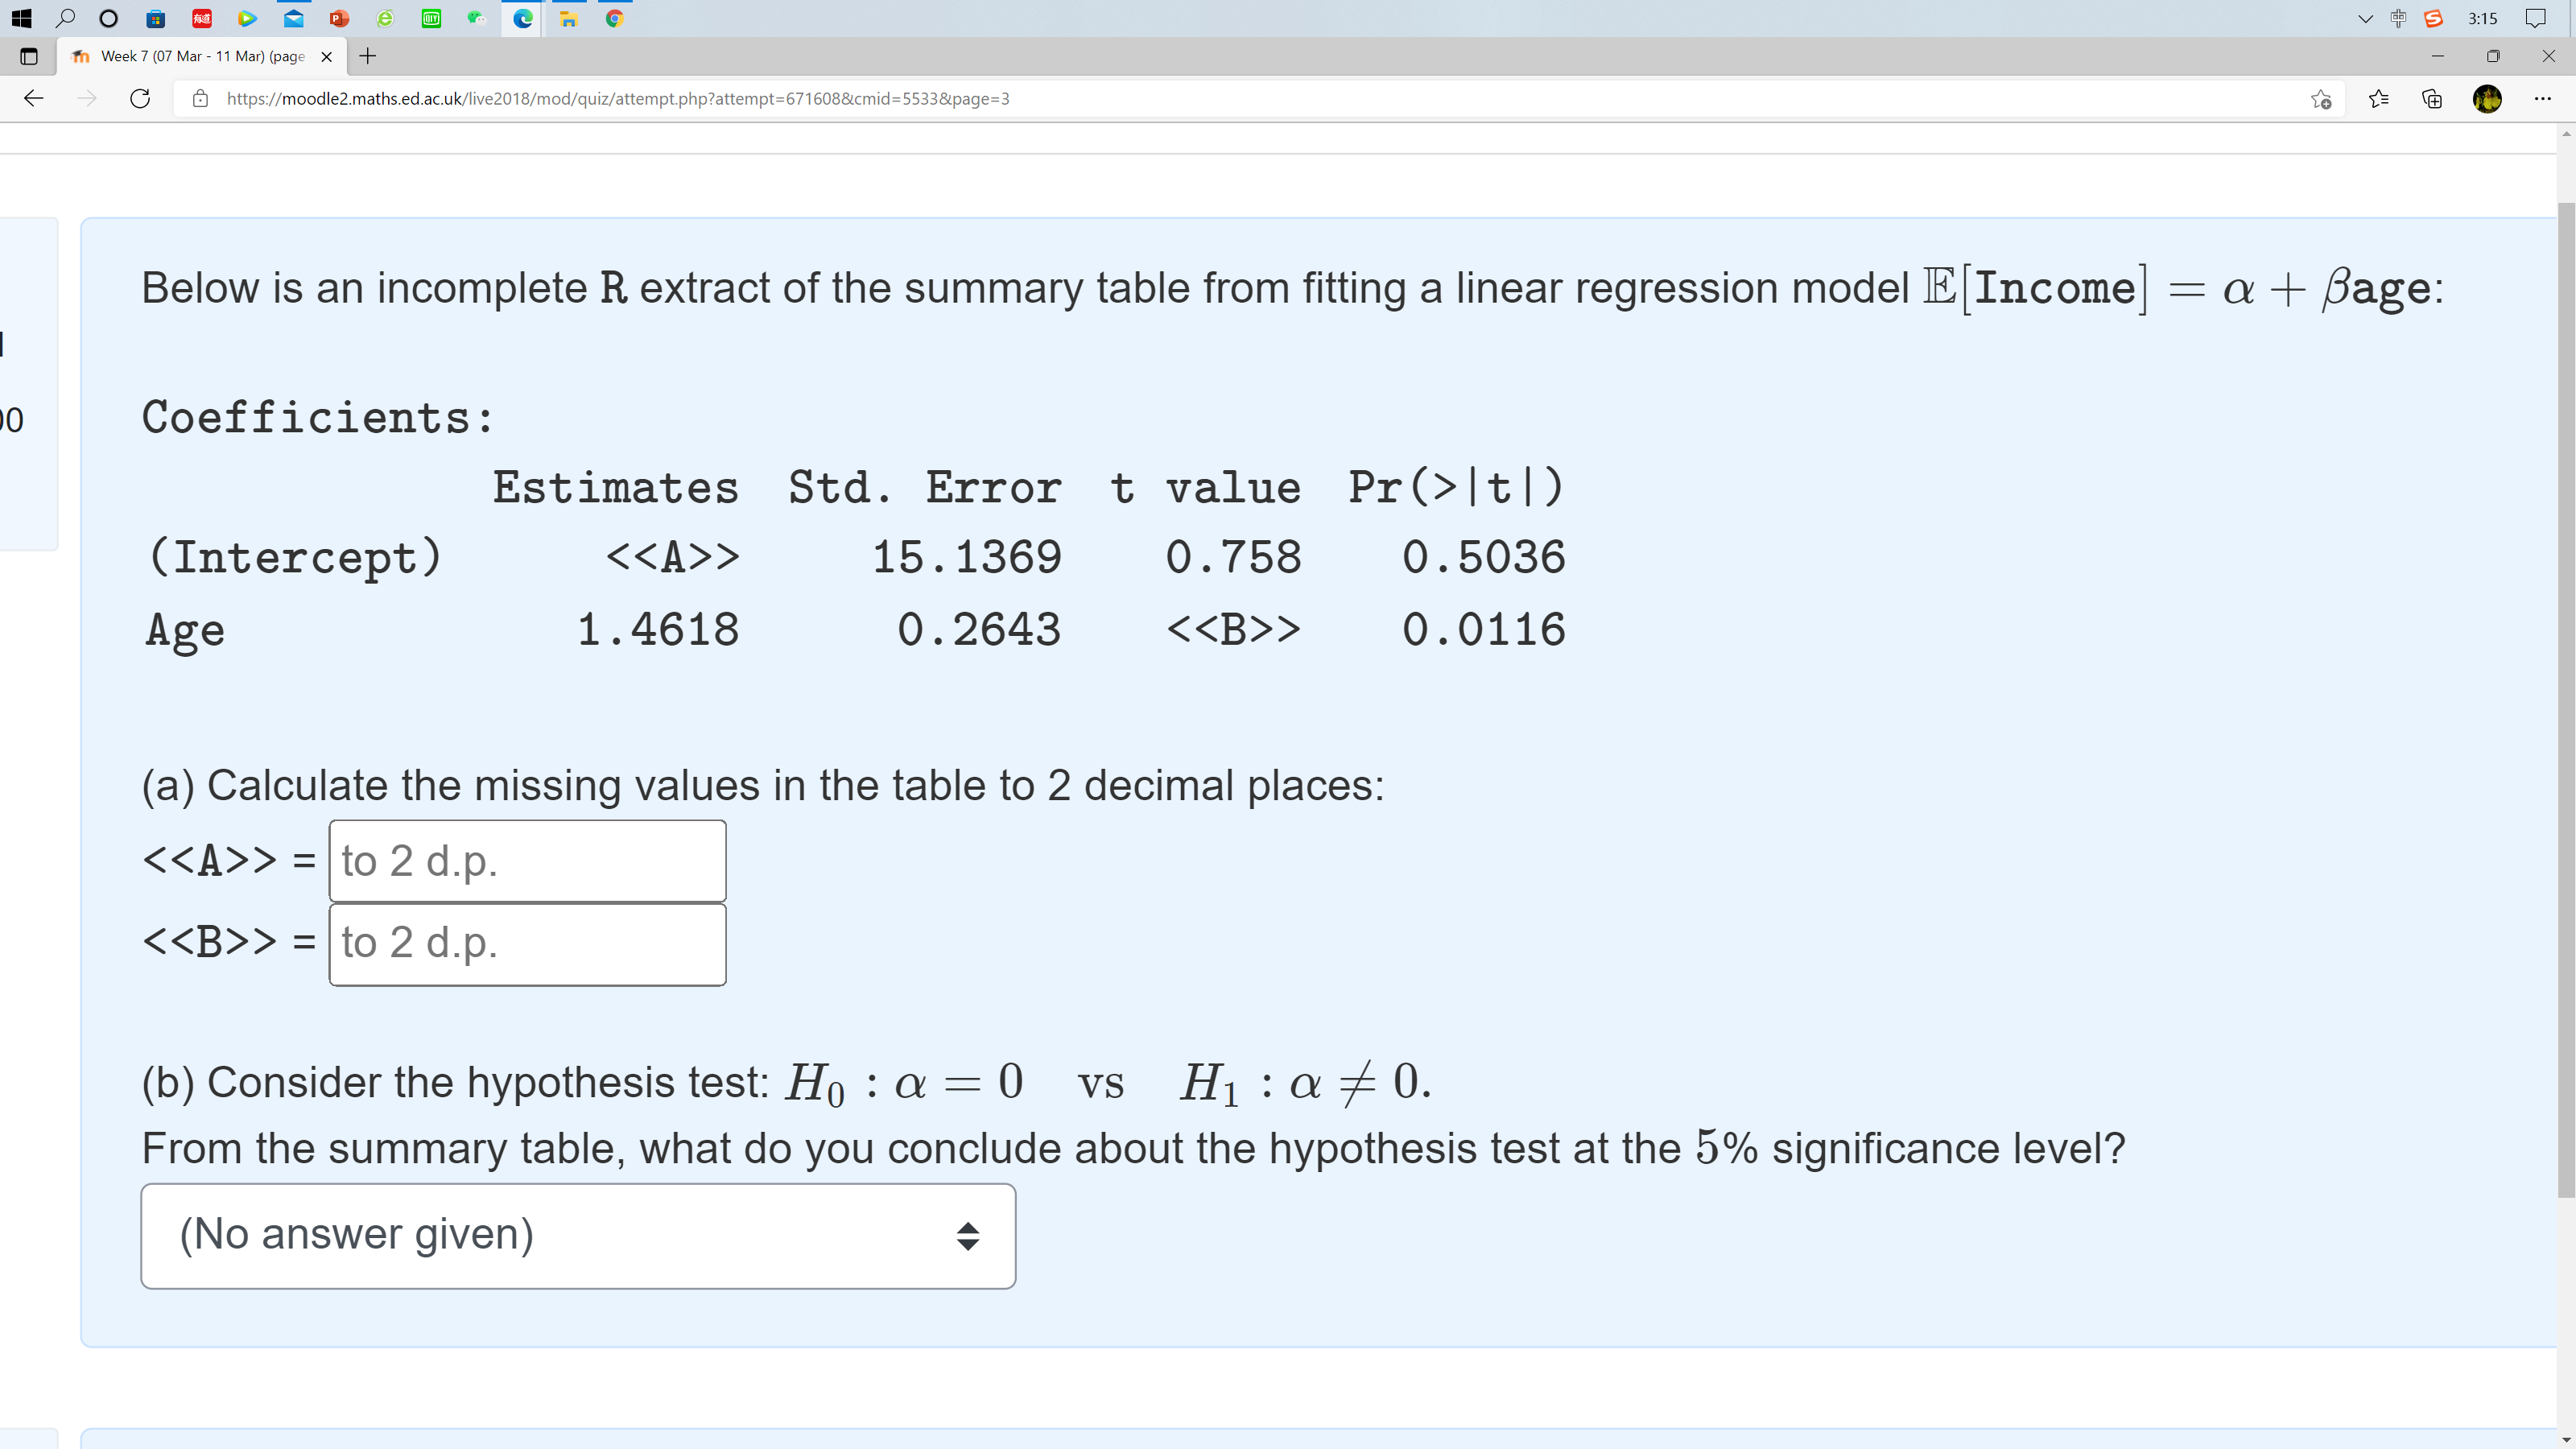
V a S 3:15 Tin Week 7 (07 Mar - 11 Mar) (page x + X C @ https://moodle2.maths.ed.ac.uk/live2018/mod/quiz/attempt.php?attempt=671608&cmid=5533&page=3 to ... Below is an incomplete R extract of the summary table from fitting a linear regression model E[Income] = a + Bage: Coefficients : Estimates Std. Error t value Pr(>Itl) (Intercept) > 15. 1369 0. 758 0 . 5036 Age 1 . 4618 0. 2643 > 0 . 0116 (a) Calculate the missing values in the table to 2 decimal places: > = to 2 d.p. > = to 2 d.p. (b) Consider the hypothesis test: Ho : a = 0 vs H1 : a * 0. From the summary table, what do you conclude about the hypothesis test at the 5% significance level? (No answer given)
Step by Step Solution
There are 3 Steps involved in it

Get step-by-step solutions from verified subject matter experts