

Question: v u p . CWC Mellel = 1 - 11 two-sample tes... A Saved Help Save & Exit Subm Check my work The following data
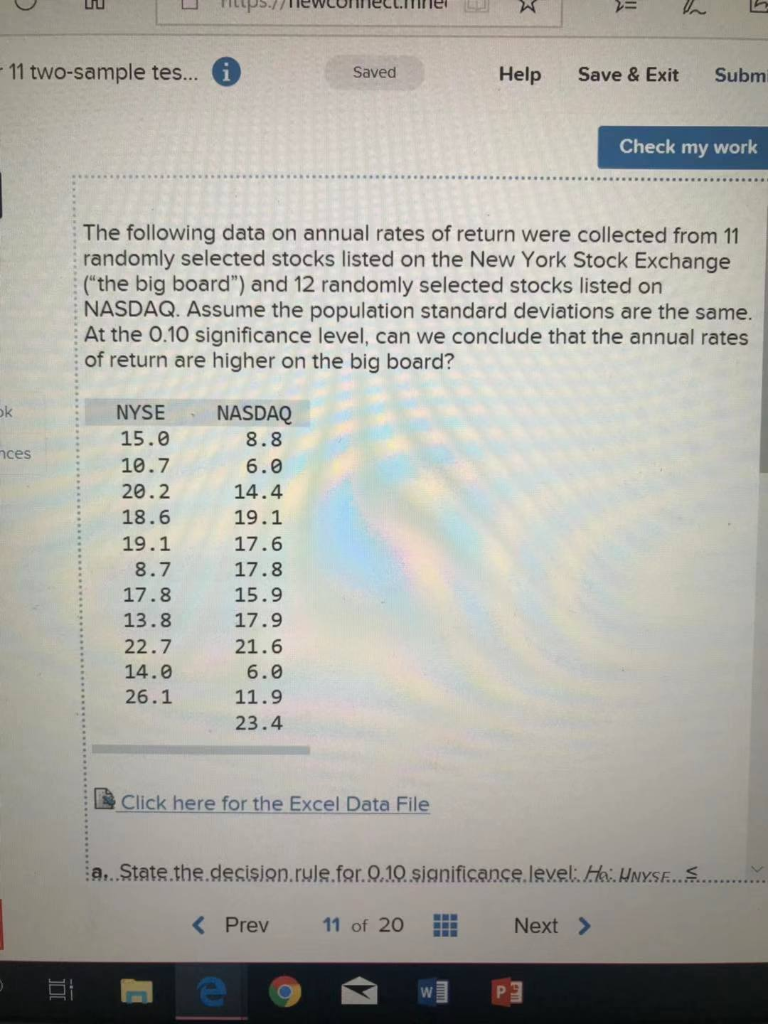
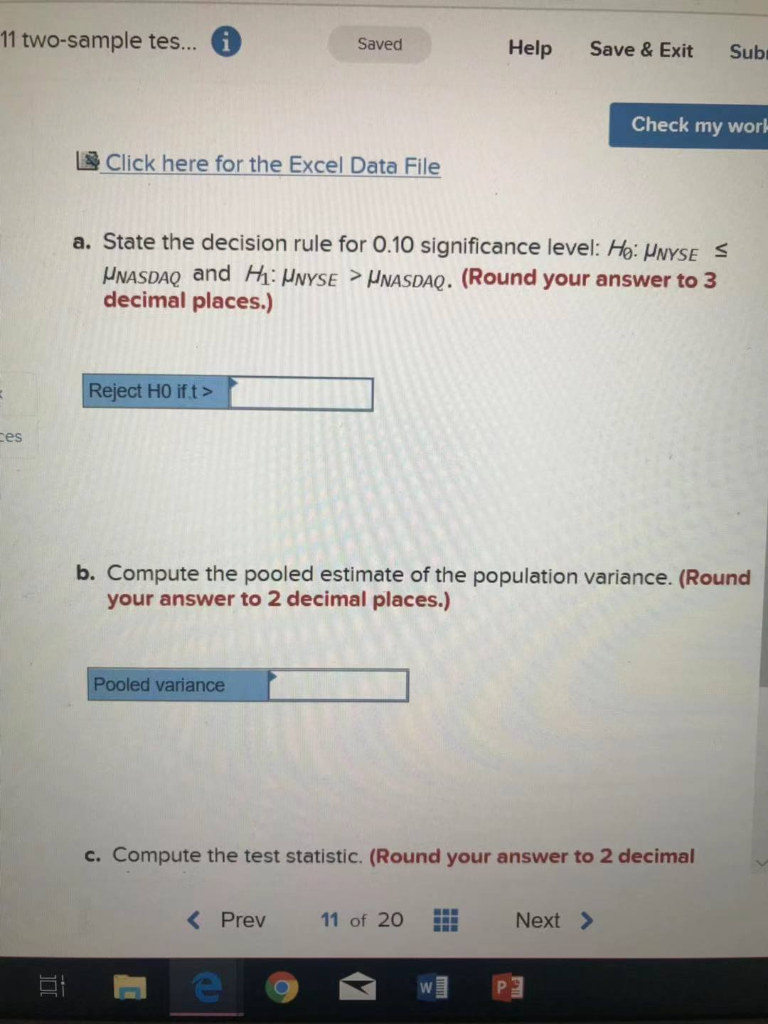
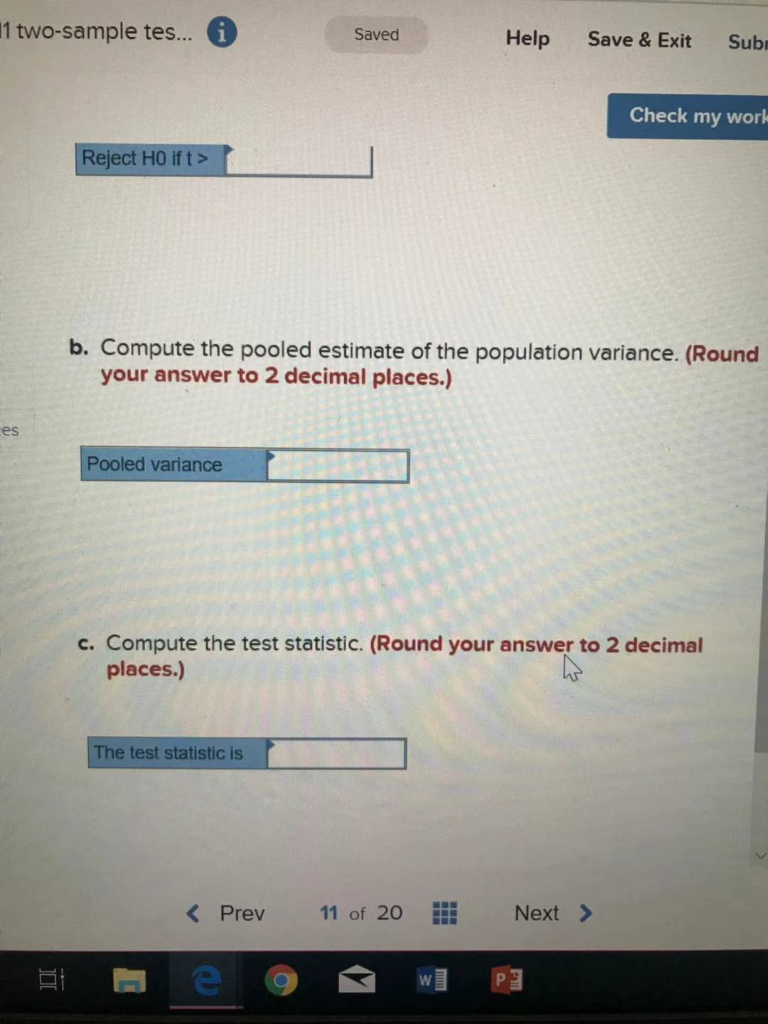
v u p . CWC Mellel = 1 - 11 two-sample tes... A Saved Help Save & Exit Subm Check my work The following data on annual rates of return were collected from 11 randomly selected stocks listed on the New York Stock Exchange ("the big board") and 12 randomly selected stocks listed on NASDAQ. Assume the population standard deviations are the same. At the 0.10 significance level, can we conclude that the annual rates of return are higher on the big board? nces NYSE 15.0 10.7 20.2 18.6 19.1 8.7 17.8 13.8 22.7 14.0 26.1 NASDAQ 8.8 6.0 14.4 19.1 17.6 17.8 15.9 17.9 21.6 6.0 11.9 23.4 Click here for the Excel Data File a. State the desisjon.rule.fer. 0.10 significance.level: Hai HNYSE..... 11 two-sample tes... i Saved Help Save & Exit Sub. Check my work Click here for the Excel Data File a. State the decision rule for 0.10 significance level: Ho: UNYSE S UNASDAQ and H MNYSE > MNASDAQ. (Round your answer to 3 decimal places.) Reject HO ift> ces b. Compute the pooled estimate of the population variance. (Round your answer to 2 decimal places.) Pooled variance c. Compute the test statistic. (Round your answer to 2 decimal 1 two-sample tes... i Saved Help Save & Exit Sub Check my world Reject Ho ift > b. Compute the pooled estimate of the population variance. (Round your answer to 2 decimal places.) es Pooled variance c. Compute the test statistic. (Round your answer to 2 decimal places.) The test statistic is v u p . CWC Mellel = 1 - 11 two-sample tes... A Saved Help Save & Exit Subm Check my work The following data on annual rates of return were collected from 11 randomly selected stocks listed on the New York Stock Exchange ("the big board") and 12 randomly selected stocks listed on NASDAQ. Assume the population standard deviations are the same. At the 0.10 significance level, can we conclude that the annual rates of return are higher on the big board? nces NYSE 15.0 10.7 20.2 18.6 19.1 8.7 17.8 13.8 22.7 14.0 26.1 NASDAQ 8.8 6.0 14.4 19.1 17.6 17.8 15.9 17.9 21.6 6.0 11.9 23.4 Click here for the Excel Data File a. State the desisjon.rule.fer. 0.10 significance.level: Hai HNYSE..... 11 two-sample tes... i Saved Help Save & Exit Sub. Check my work Click here for the Excel Data File a. State the decision rule for 0.10 significance level: Ho: UNYSE S UNASDAQ and H MNYSE > MNASDAQ. (Round your answer to 3 decimal places.) Reject HO ift> ces b. Compute the pooled estimate of the population variance. (Round your answer to 2 decimal places.) Pooled variance c. Compute the test statistic. (Round your answer to 2 decimal 1 two-sample tes... i Saved Help Save & Exit Sub Check my world Reject Ho ift > b. Compute the pooled estimate of the population variance. (Round your answer to 2 decimal places.) es Pooled variance c. Compute the test statistic. (Round your answer to 2 decimal places.) The test statistic is
Step by Step Solution
There are 3 Steps involved in it

Get step-by-step solutions from verified subject matter experts