

Question: Value the companys equity. The model in Part A includes cost of goods sold but not selling, general, and administrative (SG & A) expenses. Suppose
- Value the companys equity.
- The model in Part A includes cost of goods sold but not selling, general, and administrative (SG & A) expenses. Suppose that the firm has $200 of these expenses each year, irrespective of the level of sales. Change the model to accommodate this new assumption. Show the resulting income statements, balance sheets, the free cash flows (FCF), and the valuation.
- Build a data table in which you show the sensitivity of the equity value to the level of SG & A. Let SG & A vary from $0 per year to $600 per year.
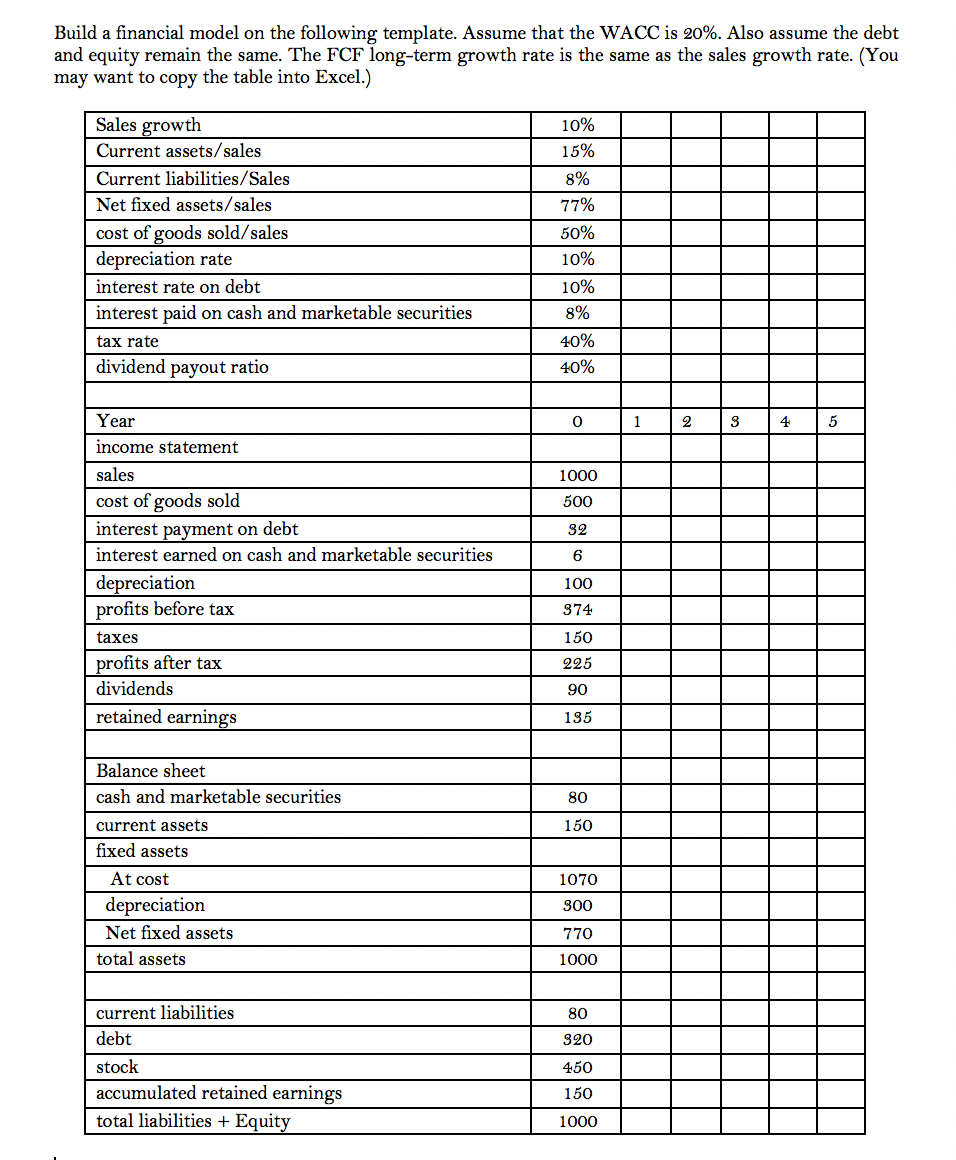
Build a financial model on the following template. Assume that the WACC is 20%. Also assume the debt and equity remain the same. The FCF long-term growth rate is the same as the sales growth rate. (You may want to copy the table into Excel.) 10% 15% 8% 77% Sales growth Current assets/sales Current liabilities/Sales Net fixed assets/ sales cost of goods sold/sales depreciation rate interest rate on debt interest paid on cash and marketable securities tax rate dividend payout ratio 50% 10% 10% 8% 40% 40% Year 0 1 2 3 5 1000 500 income statement sales cost of goods sold interest payment on debt interest earned on cash and marketable securities depreciation profits before tax 32 6 100 374 taxes 150 225 profits after tax dividends retained earnings 90 135 Balance sheet cash and marketable securities 80 150 1070 current assets fixed assets At cost depreciation Net fixed assets total assets 300 770 1000 80 current liabilities debt 320 450 stock accumulated retained earnings total liabilities + Equity 150 1000 Build a financial model on the following template. Assume that the WACC is 20%. Also assume the debt and equity remain the same. The FCF long-term growth rate is the same as the sales growth rate. (You may want to copy the table into Excel.) 10% 15% 8% 77% Sales growth Current assets/sales Current liabilities/Sales Net fixed assets/ sales cost of goods sold/sales depreciation rate interest rate on debt interest paid on cash and marketable securities tax rate dividend payout ratio 50% 10% 10% 8% 40% 40% Year 0 1 2 3 5 1000 500 income statement sales cost of goods sold interest payment on debt interest earned on cash and marketable securities depreciation profits before tax 32 6 100 374 taxes 150 225 profits after tax dividends retained earnings 90 135 Balance sheet cash and marketable securities 80 150 1070 current assets fixed assets At cost depreciation Net fixed assets total assets 300 770 1000 80 current liabilities debt 320 450 stock accumulated retained earnings total liabilities + Equity 150 1000
Step by Step Solution
There are 3 Steps involved in it

Get step-by-step solutions from verified subject matter experts