

Question: van Will show your work on the paper you will upload to an assignment immediately after completing the exam. The following table gives the age
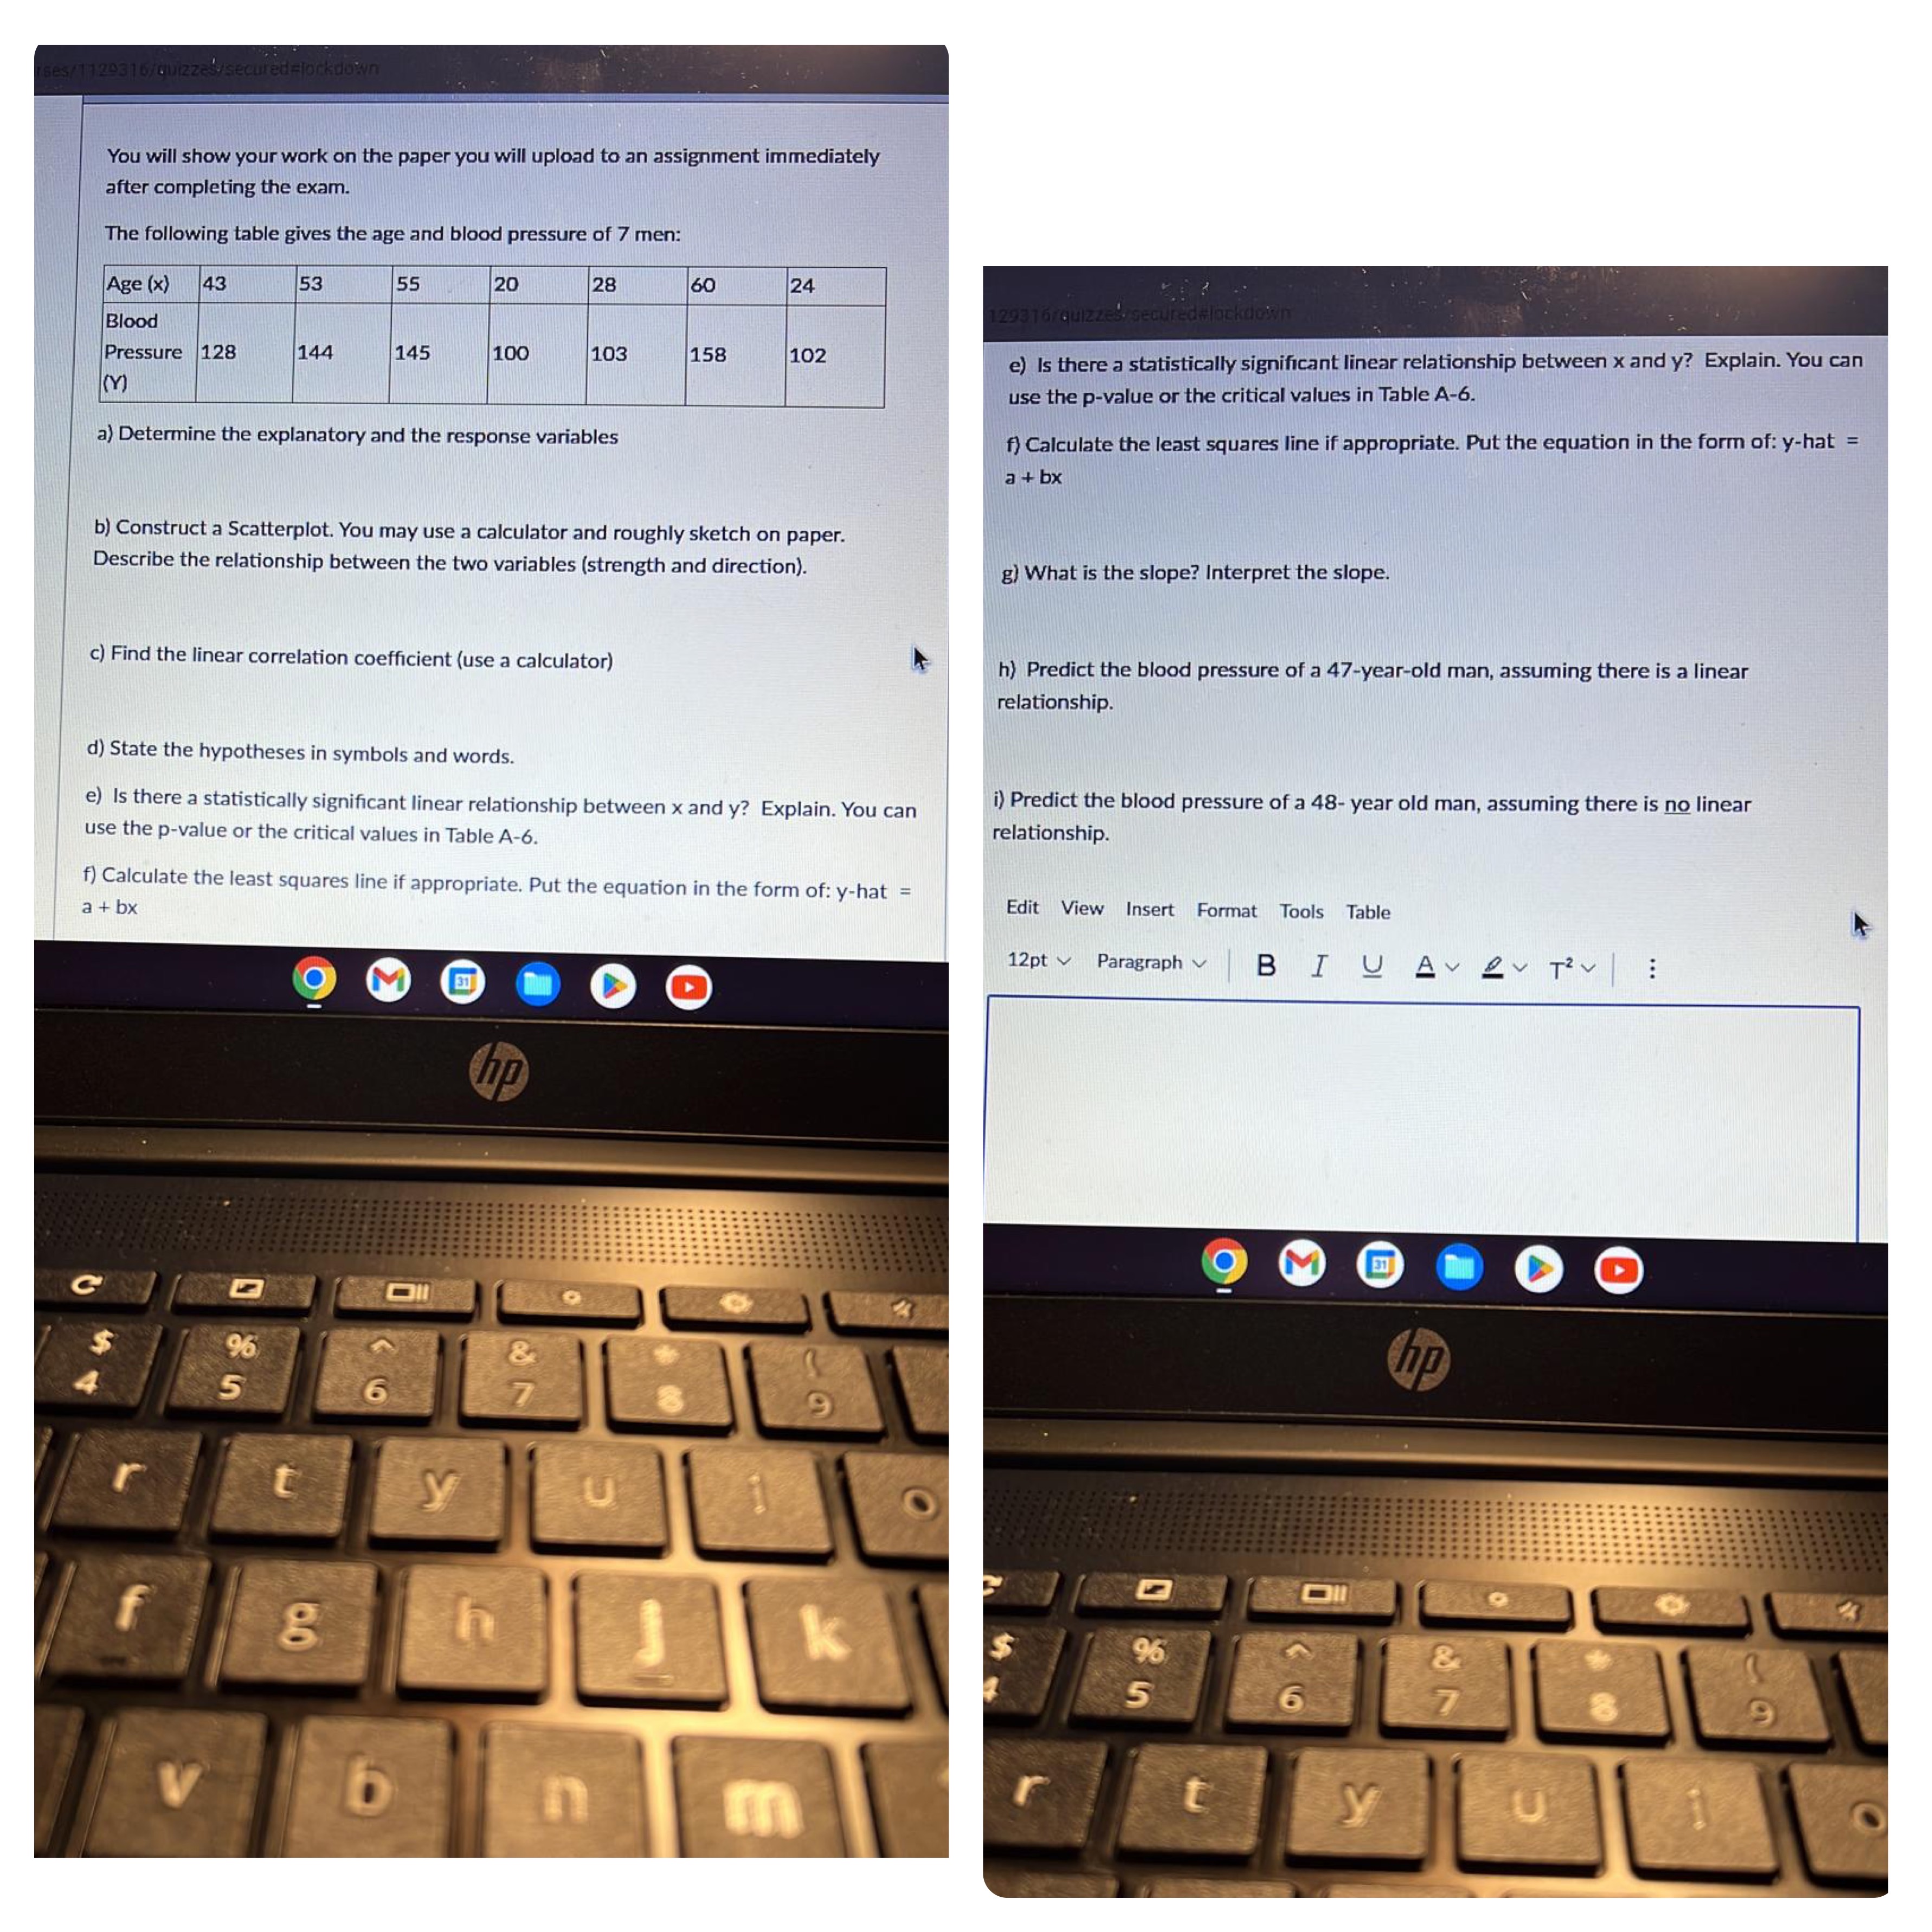

"van Will show your work on the paper you will upload to an assignment immediately after completing the exam. The following table gives the age and blood pressure of 7 men: Age (x) 43 53 55 20 28 so 24 Blood Pressure 128 144 145 100 103 158 102 (Y) a) Determine the explanatory and the response variables b) Construct a Scatterplot. You may use a calculator and roughly sketch on paper. Describe the relationship between the two variables (strength and direction). c) Find the linear correlation coefcient (use a calculator) d) State the hypotheses in symbols and words. e) is there a statistically signicant linear relationship between x and y? Explain. You can use the pv:i|ue or the critical values in Table A-6. f) Calculate the least squares line if appropriate. Put the equation in the form of: y-hat a+bx is there a statistically signicant linear relationship between x and y? Explain. You ran use the p-value or the critical values in Table A-6. f) Calculate the least squares line if appropriate. Put the equation in the form of: y-hat = a + bx 3) What is the slope? interpret the slope. h) Predict the blood pressure of a 47-year-old man, assuming there is a linear relationship. i) Predict the blood pressure of a 48- year old man, assuming there is no linear relationship. Edit View Insert Format Tools Table k 12pt v Paragmpli v B I g A v 5 v T2 v
Step by Step Solution
There are 3 Steps involved in it

Get step-by-step solutions from verified subject matter experts